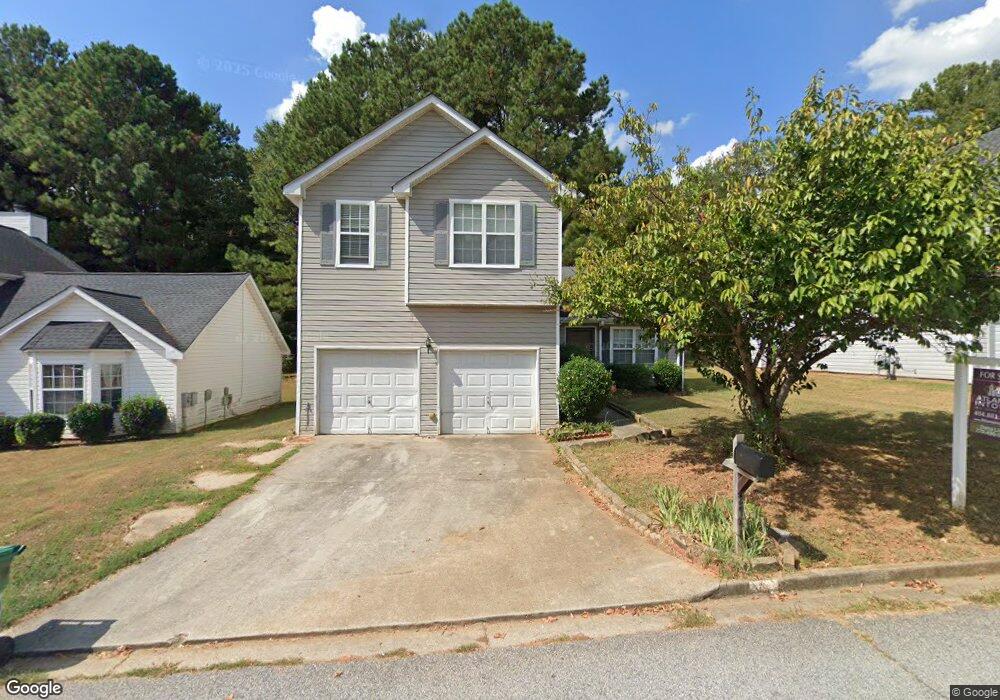
2744 Rambling Way Unit 42 Lithonia, GA 30058
Estimated Value: $233,000 - $247,000
3
Beds
3
Baths
1,684
Sq Ft
$144/Sq Ft
Est. Value
About This Home
This home is located at 2744 Rambling Way Unit 42, Lithonia, GA 30058 and is currently estimated at $241,696, approximately $143 per square foot. 2744 Rambling Way Unit 42 is a home located in DeKalb County with nearby schools including Stoneview Elementary School, Lithonia Middle School, and Lithonia High School.
Ownership History
Date
Name
Owned For
Owner Type
Purchase Details
Closed on
Jul 13, 2020
Sold by
A Rated Financial Svcs Llc
Bought by
Cooper Markia Nicole
Current Estimated Value
Home Financials for this Owner
Home Financials are based on the most recent Mortgage that was taken out on this home.
Original Mortgage
$142,961
Outstanding Balance
$126,724
Interest Rate
3.2%
Mortgage Type
FHA
Estimated Equity
$114,972
Purchase Details
Closed on
Nov 22, 2019
Sold by
Robert Towns E
Bought by
A Rated Financial Svcs
Purchase Details
Closed on
Jun 20, 2014
Sold by
Towns Lucille Estate
Bought by
Towns Robert E
Purchase Details
Closed on
Apr 30, 2001
Sold by
Stonebridge Creek Dev Co Inc
Bought by
Towns Lucille G
Home Financials for this Owner
Home Financials are based on the most recent Mortgage that was taken out on this home.
Original Mortgage
$117,400
Interest Rate
6.95%
Mortgage Type
FHA
Create a Home Valuation Report for This Property
The Home Valuation Report is an in-depth analysis detailing your home's value as well as a comparison with similar homes in the area
Home Values in the Area
Average Home Value in this Area
Purchase History
| Date | Buyer | Sale Price | Title Company |
|---|---|---|---|
| Cooper Markia Nicole | $150,000 | -- | |
| A Rated Financial Svcs | -- | -- | |
| Towns Robert E | -- | -- | |
| Towns Lucille G | $118,400 | -- |
Source: Public Records
Mortgage History
| Date | Status | Borrower | Loan Amount |
|---|---|---|---|
| Open | Cooper Markia Nicole | $142,961 | |
| Previous Owner | Towns Lucille G | $117,400 |
Source: Public Records
Tax History Compared to Growth
Tax History
| Year | Tax Paid | Tax Assessment Tax Assessment Total Assessment is a certain percentage of the fair market value that is determined by local assessors to be the total taxable value of land and additions on the property. | Land | Improvement |
|---|---|---|---|---|
| 2025 | $2,885 | $99,800 | $18,000 | $81,800 |
| 2024 | $2,959 | $100,160 | $18,000 | $82,160 |
| 2023 | $2,959 | $93,520 | $18,000 | $75,520 |
| 2022 | $2,375 | $79,320 | $8,000 | $71,320 |
| 2021 | $2,991 | $60,000 | $7,840 | $52,160 |
| 2020 | $2,659 | $53,080 | $8,000 | $45,080 |
| 2019 | $468 | $42,480 | $8,000 | $34,480 |
| 2018 | $723 | $41,080 | $8,000 | $33,080 |
| 2017 | $486 | $43,320 | $4,200 | $39,120 |
| 2016 | $471 | $37,200 | $4,200 | $33,000 |
| 2014 | $890 | $28,200 | $4,200 | $24,000 |
Source: Public Records
Map
Nearby Homes
- 2116 Charter Ln
- 6420 Marbut Rd
- 2107 Bedford Ct
- 6470 Bedford Ln
- 3034 Stonebridge Creek Dr
- 2281 Rambling Way
- 6593 Pole Creek Dr
- 6396 Stablewood Way
- 2049 Charter Ln
- 2041 Marbut Trace
- 6384 Stonebridge Creek Ln
- 6372 Stonebridge Creek Ln
- 2315 Rambling Way
- 6630 Pole Creek Dr
- 6510 Charter Way
- 2191 Phillips Rd
- 2338 Rambling Way
- 6403 Charter Way
- 6351 Stablewood Way
- 2744 Rambling Way
- 2738 Rambling Way
- 2750 Rambling Way Unit 2
- 2756 Rambling Way
- 2732 Rambling Way Unit 2
- 2743 Rambling Way
- 2743 Rambling Way
- 2749 Rambling Way Unit 2
- 2737 Rambling Way
- 2726 Rambling Way Unit 2
- 2762 Rambling Way
- 2755 Rambling Way
- 2731 Rambling Way
- 2761 Rambling Way Unit 2
- 2720 Rambling Way
- 2725 Rambling Way
- 2931 Stonebridge Creek Dr
- 2925 Stonebridge Creek Dr
- 2937 Stonebridge Creek Dr
- 2919 Stonebridge Creek Dr Unit 2