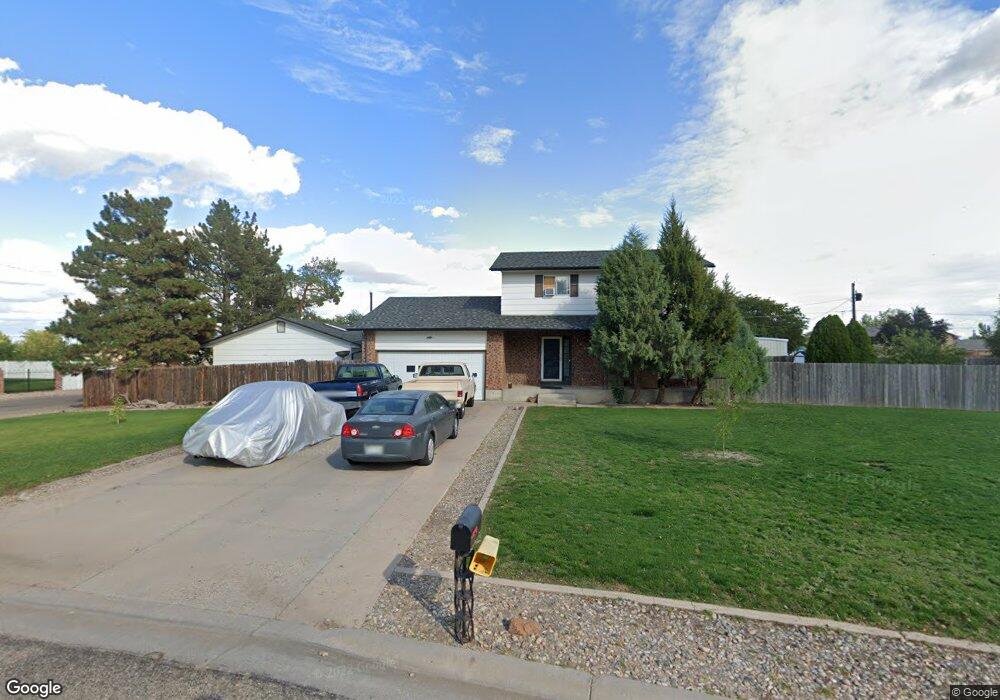
27440 Torchey Way Pueblo, CO 81006
Estimated Value: $398,702 - $468,000
3
Beds
2
Baths
1,729
Sq Ft
$249/Sq Ft
Est. Value
About This Home
This home is located at 27440 Torchey Way, Pueblo, CO 81006 and is currently estimated at $430,176, approximately $248 per square foot. 27440 Torchey Way is a home located in Pueblo County with nearby schools including South Mesa Elementary School, Pleasant View Middle School, and Pueblo County High School.
Ownership History
Date
Name
Owned For
Owner Type
Purchase Details
Closed on
Jun 12, 1998
Sold by
Yallanardo M D Jr + D M
Bought by
Yallanardo Mike D
Current Estimated Value
Purchase Details
Closed on
Apr 3, 1995
Sold by
Yallanardo Mike D
Bought by
Yallanardo M D Jr + D M
Purchase Details
Closed on
Jan 17, 1992
Sold by
Yallanardo Mike D Jr + Diana
Bought by
Yallanardo Mike D
Purchase Details
Closed on
Dec 22, 1987
Sold by
Hickman Barbara Jo
Bought by
Yallanardo Mike D Jr + Diana
Purchase Details
Closed on
Nov 6, 1987
Sold by
Vande Hoef Greeta and Vande Hickman B
Bought by
Hickman Barbara Jo
Purchase Details
Closed on
Oct 30, 1984
Sold by
Sosamon Harold R + Linda
Bought by
Vande Hoef Greeta and Vande Hickman B
Purchase Details
Closed on
Aug 18, 1981
Bought by
Sosamon Harold R + Linda
Purchase Details
Closed on
May 3, 1979
Sold by
Farmers Construction Co
Bought by
Niederstadt Richard + Janice
Purchase Details
Closed on
Jun 19, 1978
Sold by
Vande Hoef Greeta Jean
Bought by
Farmers Construction Co
Create a Home Valuation Report for This Property
The Home Valuation Report is an in-depth analysis detailing your home's value as well as a comparison with similar homes in the area
Home Values in the Area
Average Home Value in this Area
Purchase History
| Date | Buyer | Sale Price | Title Company |
|---|---|---|---|
| Yallanardo Mike D | -- | -- | |
| Yallanardo M D Jr + D M | -- | -- | |
| Yallanardo Mike D | -- | -- | |
| Yallanardo Mike D Jr + Diana | $67,000 | -- | |
| Hickman Barbara Jo | -- | -- | |
| Vande Hoef Greeta | $65,000 | -- | |
| Sosamon Harold R + Linda | $68,500 | -- | |
| Niederstadt Richard + Janice | $53,800 | -- | |
| Farmers Construction Co | -- | -- |
Source: Public Records
Tax History Compared to Growth
Tax History
| Year | Tax Paid | Tax Assessment Tax Assessment Total Assessment is a certain percentage of the fair market value that is determined by local assessors to be the total taxable value of land and additions on the property. | Land | Improvement |
|---|---|---|---|---|
| 2024 | $1,603 | $21,770 | -- | -- |
| 2023 | $1,620 | $25,460 | $2,140 | $23,320 |
| 2022 | $1,212 | $18,340 | $2,260 | $16,080 |
| 2021 | $1,267 | $18,880 | $2,330 | $16,550 |
| 2020 | $1,183 | $18,070 | $2,150 | $15,920 |
| 2019 | $1,161 | $18,070 | $2,145 | $15,925 |
| 2018 | $874 | $15,395 | $2,160 | $13,235 |
| 2017 | $895 | $15,395 | $2,160 | $13,235 |
| 2016 | $815 | $14,946 | $2,388 | $12,558 |
| 2015 | $1,607 | $14,946 | $2,388 | $12,558 |
| 2014 | $1,470 | $13,670 | $2,388 | $11,282 |
Source: Public Records
Map
Nearby Homes
- 1419 27 1 2 Ln
- 27454 Preston Rd
- 1470 Villa Spanada St
- 27111 Preston Rd
- 27193 County Farm Rd
- 27875 County Farm Rd
- 1557 28th Ln
- 28513 Hillside Rd
- Lot C Manning Rd
- Lot C Manning Rd
- 1620 Johneva St
- 1345 Terry Cir
- 1040 28th Ln
- 1143 25th Ln
- 29767 Preston Rd
- 1131 24 1 2 Ln
- 1725 Harlow Ave
- TBD Hillside Rd
- TBD 27th Ln
- 1145 Wago Dr
- 1461 Dana Ln
- 27432 Torchey Way
- 1471 Dana Ln
- 27417 Torchey Way
- 1440 Torchey Way
- 27392 Torchey Way
- 27539 Habana Rd
- 1481 Dana Ln
- 27351 Torchey Way
- 1433 Torchey Way
- 1454 Dana Ln
- 1470 Dana Ln
- 27360 Torchey Way
- 1422 Torchey Way
- 1443 27 1/2 Ln
- 27340 Habana Rd
- 27467 Preston Rd
- 1480 Dana Ln
- 27433 Preston Rd
- 27289 Torchey Way