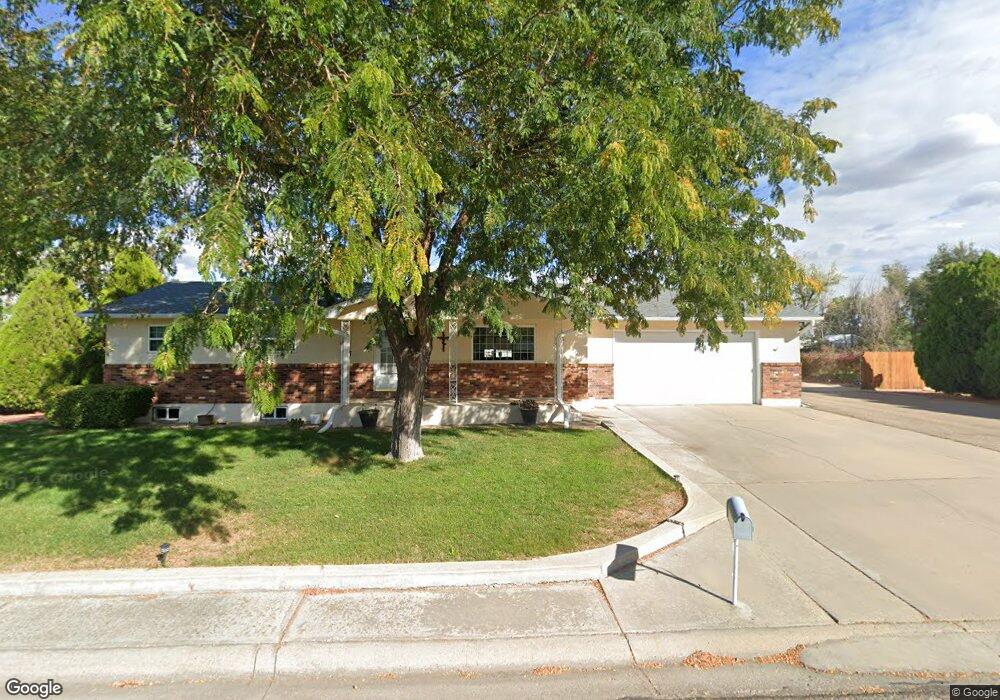
27446 Woburn Abbey Dr Pueblo, CO 81006
Estimated Value: $409,681 - $550,000
4
Beds
5
Baths
2,570
Sq Ft
$182/Sq Ft
Est. Value
About This Home
This home is located at 27446 Woburn Abbey Dr, Pueblo, CO 81006 and is currently estimated at $467,670, approximately $181 per square foot. 27446 Woburn Abbey Dr is a home located in Pueblo County with nearby schools including South Mesa Elementary School, Pleasant View Middle School, and Pueblo County High School.
Ownership History
Date
Name
Owned For
Owner Type
Purchase Details
Closed on
Oct 3, 2011
Sold by
Prudential Relocation Inc
Bought by
Ercul Allen and Ercul Jennifer
Current Estimated Value
Home Financials for this Owner
Home Financials are based on the most recent Mortgage that was taken out on this home.
Original Mortgage
$164,700
Interest Rate
4.13%
Mortgage Type
New Conventional
Purchase Details
Closed on
Sep 28, 2011
Sold by
Sciumbato Troy
Bought by
Prudential Relocation Inc
Home Financials for this Owner
Home Financials are based on the most recent Mortgage that was taken out on this home.
Original Mortgage
$164,700
Interest Rate
4.13%
Mortgage Type
New Conventional
Purchase Details
Closed on
Aug 20, 2003
Sold by
Nielson Billie J + Sharon K
Bought by
Sciumbato Troy
Purchase Details
Closed on
May 25, 1979
Sold by
Kintner Const Co Inc
Bought by
Nielson Billie J + Sharon K
Purchase Details
Closed on
Dec 28, 1978
Sold by
Acacia Development Inc
Bought by
Kintner Const Co Inc
Create a Home Valuation Report for This Property
The Home Valuation Report is an in-depth analysis detailing your home's value as well as a comparison with similar homes in the area
Home Values in the Area
Average Home Value in this Area
Purchase History
| Date | Buyer | Sale Price | Title Company |
|---|---|---|---|
| Ercul Allen | $205,900 | None Available | |
| Prudential Relocation Inc | $205,900 | None Available | |
| Sciumbato Troy | $165,000 | -- | |
| Nielson Billie J + Sharon K | $49,900 | -- | |
| Kintner Const Co Inc | $7,900 | -- |
Source: Public Records
Mortgage History
| Date | Status | Borrower | Loan Amount |
|---|---|---|---|
| Previous Owner | Ercul Allen | $164,700 |
Source: Public Records
Tax History Compared to Growth
Tax History
| Year | Tax Paid | Tax Assessment Tax Assessment Total Assessment is a certain percentage of the fair market value that is determined by local assessors to be the total taxable value of land and additions on the property. | Land | Improvement |
|---|---|---|---|---|
| 2024 | $2,646 | $25,050 | -- | -- |
| 2023 | $2,675 | $28,730 | $1,760 | $26,970 |
| 2022 | $2,639 | $24,990 | $2,260 | $22,730 |
| 2021 | $2,759 | $25,720 | $2,330 | $23,390 |
| 2020 | $2,003 | $15,020 | $2,150 | $12,870 |
| 2019 | $1,964 | $18,625 | $2,145 | $16,480 |
| 2018 | $1,678 | $15,899 | $2,160 | $13,739 |
| 2017 | $1,718 | $15,899 | $2,160 | $13,739 |
| 2016 | $1,713 | $15,833 | $2,388 | $13,445 |
| 2015 | $1,540 | $15,833 | $2,388 | $13,445 |
| 2014 | $1,540 | $14,321 | $2,388 | $11,933 |
Source: Public Records
Map
Nearby Homes
- 27193 County Farm Rd
- 27875 County Farm Rd
- 1419 27 1 2 Ln
- 28513 Hillside Rd
- 1040 28th Ln
- 1470 Villa Spanada St
- 27111 Preston Rd
- 27454 Preston Rd
- 1143 25th Ln
- 1557 28th Ln
- 26680 Everett Rd
- 1131 24 1 2 Ln
- 1345 Terry Cir
- 24484 Gale Rd
- TBD US Hwy 50
- TBD Hillside Rd
- 945 29th Ln
- 1145 Wago Dr
- 931 25th Ln
- 28922 Everett Rd
- 27458 Woburn Abbey Dr
- 1235 Valdez Dr
- 27434 Woburn Abbey Dr
- 27391 Woburn Abbey Dr
- 27422 Woburn Abbey Dr
- 27457 Woburn Abbey Dr
- 1221 Valdez Dr
- 27470 Woburn Abbey Dr
- 27374 Woburn Abbey Dr
- 27343 Woburn Abbey Dr
- 27469 Woburn Abbey Dr
- 27288 Hillside Rd
- 1249 Valdez Dr
- 1205 Valdez Dr
- 27449 Hillside Rd
- 27328 Hillside Rd
- 27312 Woburn Abbey Dr
- 27531 Hillside Rd
- 27281 Woburn Abbey Dr
- 27477 Hillside Rd