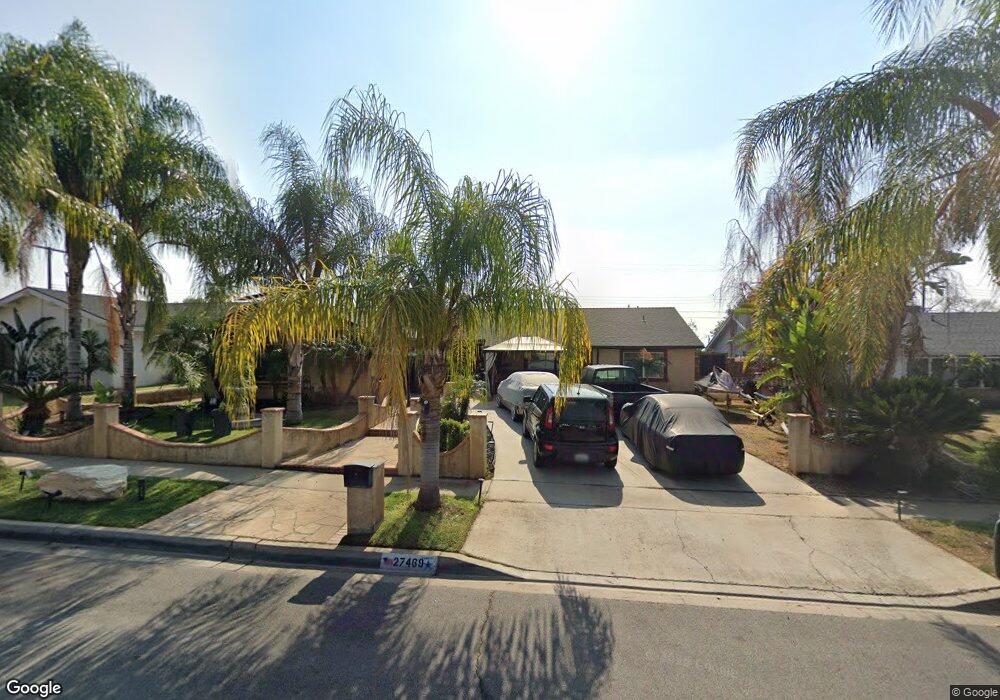
27469 Stratford St Highland, CA 92346
Crossroads NeighborhoodEstimated Value: $554,000 - $635,000
4
Beds
2
Baths
2,132
Sq Ft
$274/Sq Ft
Est. Value
About This Home
This home is located at 27469 Stratford St, Highland, CA 92346 and is currently estimated at $584,508, approximately $274 per square foot. 27469 Stratford St is a home located in San Bernardino County with nearby schools including Thompson Elementary School, Serrano Middle School, and San Gorgonio High School.
Ownership History
Date
Name
Owned For
Owner Type
Purchase Details
Closed on
Oct 8, 2002
Sold by
Murillo Rosa E
Bought by
Renteria Francisco and Morin Diane
Current Estimated Value
Home Financials for this Owner
Home Financials are based on the most recent Mortgage that was taken out on this home.
Original Mortgage
$182,422
Interest Rate
6.03%
Mortgage Type
FHA
Purchase Details
Closed on
Sep 6, 2001
Sold by
Johnson Steven Paul
Bought by
Murillo Rosa E
Purchase Details
Closed on
Jun 16, 1999
Sold by
Johnson Shirley A
Bought by
Johnson Steven Paul and Johnson Bonnie Jean
Home Financials for this Owner
Home Financials are based on the most recent Mortgage that was taken out on this home.
Original Mortgage
$120,000
Interest Rate
7.2%
Purchase Details
Closed on
Nov 2, 1998
Sold by
Johnson Shirley A
Bought by
Johnson Shirley A and Johnson Steven Paul
Create a Home Valuation Report for This Property
The Home Valuation Report is an in-depth analysis detailing your home's value as well as a comparison with similar homes in the area
Home Values in the Area
Average Home Value in this Area
Purchase History
| Date | Buyer | Sale Price | Title Company |
|---|---|---|---|
| Renteria Francisco | $185,000 | Fidelity National Title | |
| Murillo Rosa E | $169,000 | Chicago Title Co | |
| Johnson Steven Paul | -- | Old Republic Title Company | |
| Johnson Shirley A | -- | United Title Company |
Source: Public Records
Mortgage History
| Date | Status | Borrower | Loan Amount |
|---|---|---|---|
| Previous Owner | Renteria Francisco | $182,422 | |
| Previous Owner | Johnson Steven Paul | $120,000 |
Source: Public Records
Tax History Compared to Growth
Tax History
| Year | Tax Paid | Tax Assessment Tax Assessment Total Assessment is a certain percentage of the fair market value that is determined by local assessors to be the total taxable value of land and additions on the property. | Land | Improvement |
|---|---|---|---|---|
| 2025 | $3,628 | $267,941 | $66,985 | $200,956 |
| 2024 | $3,628 | $262,688 | $65,672 | $197,016 |
| 2023 | $3,548 | $257,537 | $64,384 | $193,153 |
| 2022 | $3,548 | $252,488 | $63,122 | $189,366 |
| 2021 | $3,513 | $247,537 | $61,884 | $185,653 |
| 2020 | $3,508 | $244,998 | $61,249 | $183,749 |
| 2019 | $3,390 | $240,194 | $60,048 | $180,146 |
| 2018 | $3,285 | $235,485 | $58,871 | $176,614 |
| 2017 | $2,938 | $230,868 | $57,717 | $173,151 |
| 2016 | $2,850 | $226,341 | $56,585 | $169,756 |
| 2015 | $3,502 | $222,941 | $55,735 | $167,206 |
| 2014 | $3,349 | $218,574 | $54,643 | $163,931 |
Source: Public Records
Map
Nearby Homes
- 6986 Church Ave
- 7001 Church Ave Unit 5
- 27471 Main St
- 27256 13th St
- 27240 Main St
- 6941 La Praix St
- 27164 Pacific St
- 0 Pacific St Unit OC25120346
- 27856 Fieldstone Dr
- 27328 Norwood St
- 7511 Buckeye St
- 6823 Orange St
- 7341 Lillian Ln
- 2246 Springmeadow Ct
- 2255 Springmeadow Ct
- 27034 Villa Ave
- 3531 Rainbow Ln
- 1564 Olive Tree Ln
- 3532 Rainbow Ln Unit 2
- 3504 Rainbow Ln
- 27457 Stratford St
- 27460 14th St
- 27450 14th St
- 27470 14th St
- 27491 Stratford St
- 27445 Stratford St
- 27480 14th St
- 27440 14th St
- 27470 Stratford St
- 27460 Stratford St
- 27482 Stratford St
- 27433 Stratford St
- 27450 Stratford St
- 27492 Stratford St
- 27430 14th St
- 7131 Bradford Ave
- 27438 Stratford St
- 7132 Church Ave
- 27461 14th St
- 27421 Stratford St