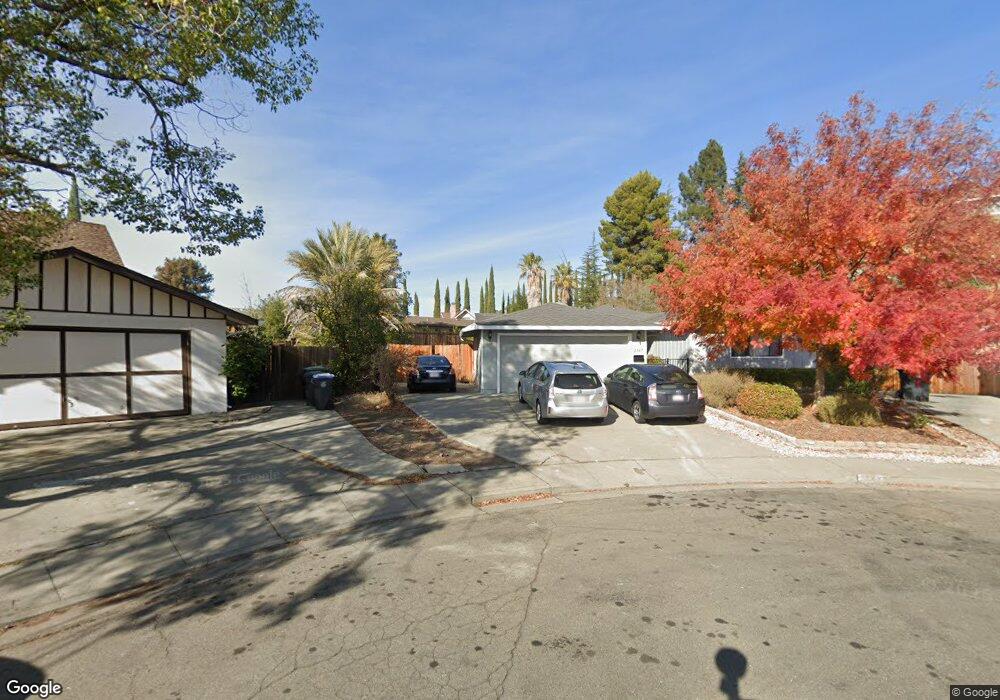
2747 Chamise Ct Fairfield, CA 94533
Estimated Value: $531,000 - $627,000
4
Beds
3
Baths
1,894
Sq Ft
$307/Sq Ft
Est. Value
About This Home
This home is located at 2747 Chamise Ct, Fairfield, CA 94533 and is currently estimated at $581,731, approximately $307 per square foot. 2747 Chamise Ct is a home located in Solano County with nearby schools including Dover Elementary School, Grange Middle School, and Fairfield High School.
Ownership History
Date
Name
Owned For
Owner Type
Purchase Details
Closed on
Oct 22, 2007
Sold by
Meyer Jeanine
Bought by
Meyer James E and Meyer Jeanine T
Current Estimated Value
Purchase Details
Closed on
Jun 10, 2002
Sold by
Meyer James
Bought by
Meyer Jeanine
Home Financials for this Owner
Home Financials are based on the most recent Mortgage that was taken out on this home.
Original Mortgage
$198,700
Outstanding Balance
$77,691
Interest Rate
5.75%
Estimated Equity
$504,040
Purchase Details
Closed on
Jun 6, 2002
Sold by
Hockman Lester L and Hockman Juanita D
Bought by
Meyer Jeanine T
Home Financials for this Owner
Home Financials are based on the most recent Mortgage that was taken out on this home.
Original Mortgage
$198,700
Outstanding Balance
$77,691
Interest Rate
5.75%
Estimated Equity
$504,040
Create a Home Valuation Report for This Property
The Home Valuation Report is an in-depth analysis detailing your home's value as well as a comparison with similar homes in the area
Home Values in the Area
Average Home Value in this Area
Purchase History
| Date | Buyer | Sale Price | Title Company |
|---|---|---|---|
| Meyer James E | -- | None Available | |
| Meyer Jeanine | -- | Fidelity National Title Co | |
| Meyer Jeanine T | $265,000 | Fidelity National Title Co |
Source: Public Records
Mortgage History
| Date | Status | Borrower | Loan Amount |
|---|---|---|---|
| Open | Meyer Jeanine T | $198,700 |
Source: Public Records
Tax History
| Year | Tax Paid | Tax Assessment Tax Assessment Total Assessment is a certain percentage of the fair market value that is determined by local assessors to be the total taxable value of land and additions on the property. | Land | Improvement |
|---|---|---|---|---|
| 2025 | $4,300 | $391,474 | $96,018 | $295,456 |
| 2024 | $4,300 | $383,799 | $94,136 | $289,663 |
| 2023 | $4,166 | $376,275 | $92,291 | $283,984 |
| 2022 | $4,114 | $368,898 | $90,482 | $278,416 |
| 2021 | $4,072 | $361,665 | $88,708 | $272,957 |
| 2020 | $3,976 | $357,958 | $87,799 | $270,159 |
| 2019 | $3,876 | $350,940 | $86,078 | $264,862 |
| 2018 | $4,000 | $344,060 | $84,391 | $259,669 |
| 2017 | $3,813 | $337,315 | $82,737 | $254,578 |
| 2016 | $3,682 | $322,000 | $67,000 | $255,000 |
| 2015 | $3,016 | $279,000 | $61,000 | $218,000 |
| 2014 | $2,714 | $249,000 | $55,000 | $194,000 |
Source: Public Records
Map
Nearby Homes
- 2731 Orchid St
- 2698 Laurel Dr
- 2932 Montclair Way
- 278 Jasmine St
- 413 Violet Ct
- 2915 N Texas St Unit 129
- 300 Begonia Blvd
- 2611 Lilac St
- 15 Dali Ct
- 3005 Marigold Dr
- 209 Begonia Blvd
- 2825 Sundown Cir
- 2827 Sunburst Dr
- 223 Camellia St
- 41 Goya Dr
- 45 Goya Dr
- 120 Goya Dr
- 500 Asbury Ln
- 501 Asbury Ln
- 50 Anza Ct
- 332 Gardenia Cir
- 2750 Chamise Ct
- 2741 Chamise Ct
- 338 Gardenia Cir
- 326 Gardenia Cir
- 344 Gardenia Cir
- 2744 Chamise Ct
- 2735 Chamise Ct
- 2802 Iris Ct
- 350 Gardenia Cir
- 320 Gardenia Cir
- 2738 Chamise Ct
- 2800 Iris Ct
- 370 Honeysuckle Dr
- 2749 Lupin Ct
- 364 Honeysuckle Dr
- 323 Gardenia Cir
- 2743 Lupin Ct
- 280 Larkspur Ln
- 314 Gardenia Cir
Your Personal Tour Guide
Ask me questions while you tour the home.