Estimated Value: $466,000 - $525,000
5
Beds
2
Baths
1,505
Sq Ft
$330/Sq Ft
Est. Value
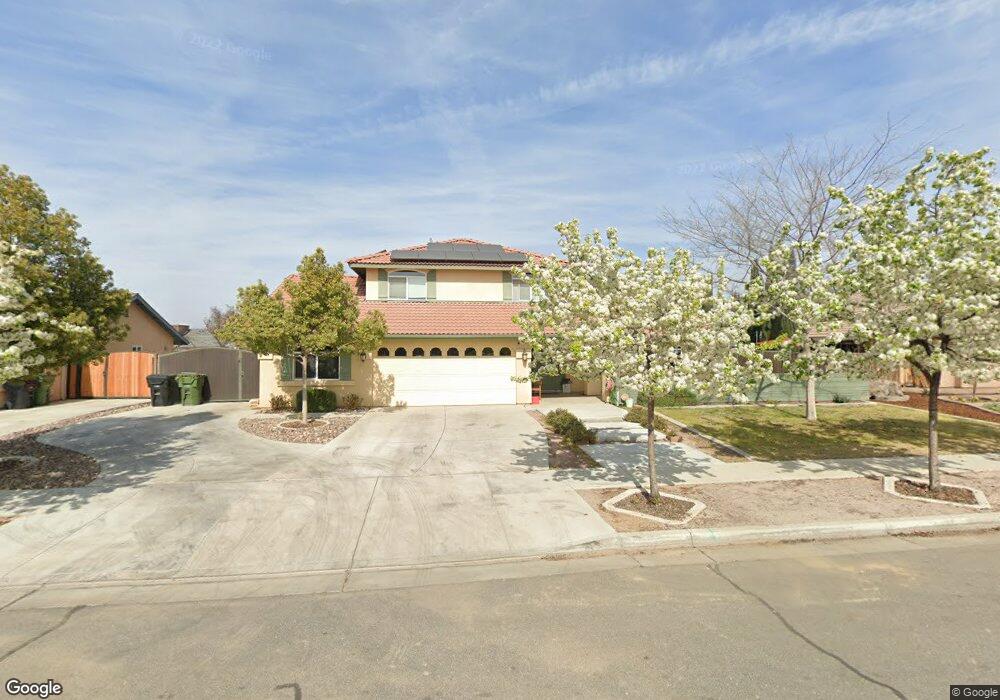
About This Home
This home is located at 2748 Chardonnay Ln, Wasco, CA 93280 and is currently estimated at $495,900, approximately $329 per square foot. 2748 Chardonnay Ln is a home with nearby schools including John L. Prueitt Elementary School, Thomas Jefferson Middle School, and Wasco High School.
Ownership History
Date
Name
Owned For
Owner Type
Purchase Details
Closed on
May 8, 2024
Sold by
Garza David F and Garza Thamar A
Bought by
Garza
Current Estimated Value
Purchase Details
Closed on
Nov 19, 2013
Sold by
Shafter Housing Llc
Bought by
Freedom Homes Real Estate Iv
Home Financials for this Owner
Home Financials are based on the most recent Mortgage that was taken out on this home.
Original Mortgage
$243,851
Interest Rate
3.87%
Mortgage Type
FHA
Purchase Details
Closed on
Nov 14, 2013
Sold by
Freedom Homes Real Estate Iv
Bought by
Garza David and Garza Thamar
Home Financials for this Owner
Home Financials are based on the most recent Mortgage that was taken out on this home.
Original Mortgage
$243,851
Interest Rate
3.87%
Mortgage Type
FHA
Purchase Details
Closed on
Feb 10, 2011
Sold by
Ennis Land Development Inc
Bought by
Shafter Housing Llc
Create a Home Valuation Report for This Property
The Home Valuation Report is an in-depth analysis detailing your home's value as well as a comparison with similar homes in the area
Home Values in the Area
Average Home Value in this Area
Purchase History
| Date | Buyer | Sale Price | Title Company |
|---|---|---|---|
| Garza | -- | None Listed On Document | |
| Freedom Homes Real Estate Iv | -- | Placer Title Company | |
| Garza David | $248,500 | Placer Title Company | |
| Shafter Housing Llc | -- | Fidelity National Title Co |
Source: Public Records
Mortgage History
| Date | Status | Borrower | Loan Amount |
|---|---|---|---|
| Previous Owner | Garza David | $243,851 |
Source: Public Records
Tax History Compared to Growth
Tax History
| Year | Tax Paid | Tax Assessment Tax Assessment Total Assessment is a certain percentage of the fair market value that is determined by local assessors to be the total taxable value of land and additions on the property. | Land | Improvement |
|---|---|---|---|---|
| 2025 | $4,261 | $335,838 | $49,029 | $286,809 |
| 2024 | $4,139 | $329,254 | $48,068 | $281,186 |
| 2023 | $4,139 | $322,799 | $47,126 | $275,673 |
| 2022 | $4,026 | $316,470 | $46,202 | $270,268 |
| 2021 | $3,705 | $280,854 | $45,297 | $235,557 |
| 2020 | $3,480 | $277,975 | $44,833 | $233,142 |
| 2019 | $3,457 | $277,975 | $44,833 | $233,142 |
| 2018 | $3,461 | $267,183 | $43,093 | $224,090 |
| 2017 | $3,369 | $261,946 | $42,249 | $219,697 |
| 2016 | $3,082 | $256,811 | $41,421 | $215,390 |
| 2015 | $2,906 | $252,954 | $40,799 | $212,155 |
| 2014 | $2,947 | $248,000 | $40,000 | $208,000 |
Source: Public Records
Map
Nearby Homes
- 901 Cabernet Dr
- 0 Central Unit 202502202
- 0 Central Unit 202502095
- 2700 7th St
- 2216 9th St
- 1440 Aspen Ave
- 1701 San Jose Ave
- 1921 Cherrytree Way
- 1917 3rd St
- 1832 4th St
- 1812 San Jose Ave
- 625 Cedar Ave
- 1622 6th St
- 1750 Bay Meadows Dr
- 1026 Birch Ave
- 1509 5th St
- 0 3rd St
- 916 Oak Ave
- 1034 Oak Ave
- 0 Laredo St Unit 202508732
- 2740 Chardonnay Ln
- 2756 Chardonnay Ln
- 2757 Grape Vine Ln
- 2749 Grape Vine Ln
- 2765 Grape Vine Ln
- 2732 Chardonnay Ln
- 2764 Chardonnay Ln
- 2741 Grape Vine Ln
- 2741 Chardonnay Ln
- 2749 Chardonnay Ln
- 2773 Grape Vine Ln
- 2733 Chardonnay Ln
- 2733 Grape Vine Ln
- 2757 Chardonnay Ln
- 2724 Chardonnay Ln
- 2772 Chardonnay Ln
- 2781 Grape Vine Ln
- 2756 Grape Vine Ln
- 2748 Grape Vine Ln
- 2765 Chardonnay Ln