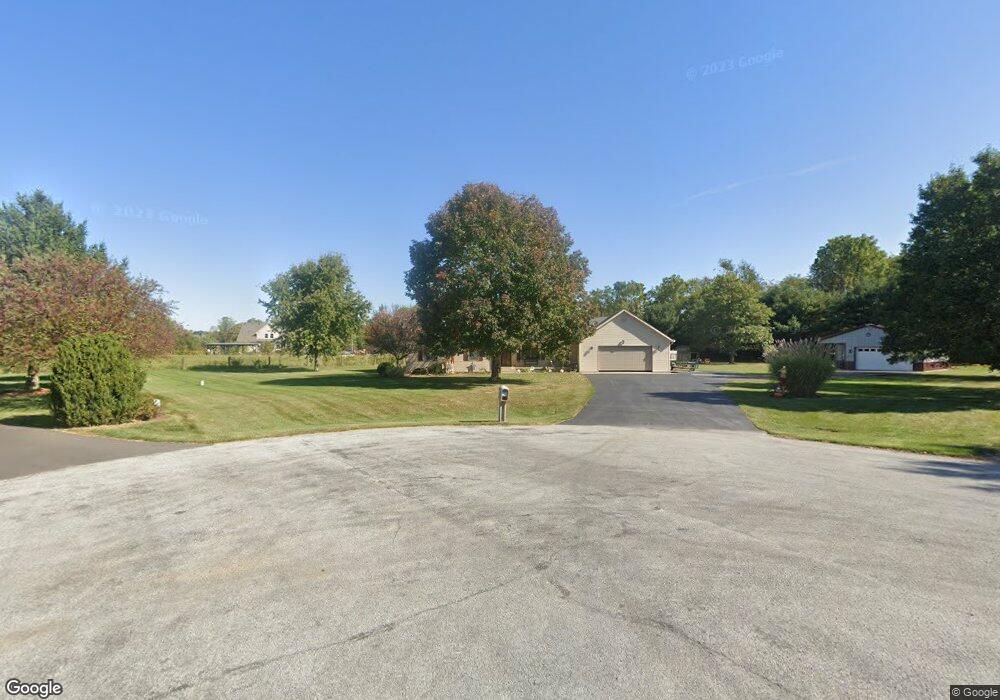
2748 Lonesome Dove Ln E Springfield, OH 45505
Estimated Value: $369,000 - $458,000
3
Beds
3
Baths
2,223
Sq Ft
$178/Sq Ft
Est. Value
About This Home
This home is located at 2748 Lonesome Dove Ln E, Springfield, OH 45505 and is currently estimated at $394,902, approximately $177 per square foot. 2748 Lonesome Dove Ln E is a home located in Clark County with nearby schools including Shawnee Middle School/High School, Springfield Preparatory & Fitness Academy, and Risen Christ Lutheran School.
Ownership History
Date
Name
Owned For
Owner Type
Purchase Details
Closed on
Oct 21, 2011
Sold by
Lute Kenneth J and Lute Stephanie L
Bought by
Oakley Kenneth W
Current Estimated Value
Home Financials for this Owner
Home Financials are based on the most recent Mortgage that was taken out on this home.
Original Mortgage
$176,165
Outstanding Balance
$120,093
Interest Rate
4.09%
Mortgage Type
Future Advance Clause Open End Mortgage
Estimated Equity
$274,809
Purchase Details
Closed on
May 26, 1999
Sold by
Sothard Howard A and Sothard Elaine K
Bought by
Lute Kenneth J and Lute Stephanie L
Home Financials for this Owner
Home Financials are based on the most recent Mortgage that was taken out on this home.
Original Mortgage
$154,700
Interest Rate
6.92%
Purchase Details
Closed on
Nov 27, 1996
Sold by
Ladder Oak Investments
Bought by
Dolores J Horne
Create a Home Valuation Report for This Property
The Home Valuation Report is an in-depth analysis detailing your home's value as well as a comparison with similar homes in the area
Home Values in the Area
Average Home Value in this Area
Purchase History
| Date | Buyer | Sale Price | Title Company |
|---|---|---|---|
| Oakley Kenneth W | $170,000 | Attorney | |
| Lute Kenneth J | $171,900 | -- | |
| Dolores J Horne | $10,000 | -- |
Source: Public Records
Mortgage History
| Date | Status | Borrower | Loan Amount |
|---|---|---|---|
| Open | Oakley Kenneth W | $176,165 | |
| Previous Owner | Lute Kenneth J | $154,700 |
Source: Public Records
Tax History Compared to Growth
Tax History
| Year | Tax Paid | Tax Assessment Tax Assessment Total Assessment is a certain percentage of the fair market value that is determined by local assessors to be the total taxable value of land and additions on the property. | Land | Improvement |
|---|---|---|---|---|
| 2024 | $4,520 | $92,180 | $18,780 | $73,400 |
| 2023 | $4,520 | $92,180 | $18,780 | $73,400 |
| 2022 | $4,483 | $92,180 | $18,780 | $73,400 |
| 2021 | $3,598 | $66,210 | $13,420 | $52,790 |
| 2020 | $3,310 | $60,510 | $13,420 | $47,090 |
| 2019 | $3,359 | $60,510 | $13,420 | $47,090 |
| 2018 | $3,142 | $55,880 | $13,420 | $42,460 |
| 2017 | $3,225 | $56,316 | $13,416 | $42,900 |
| 2016 | $2,924 | $56,316 | $13,416 | $42,900 |
| 2015 | $3,049 | $58,563 | $13,416 | $45,147 |
| 2014 | $3,057 | $58,563 | $13,416 | $45,147 |
| 2013 | $2,657 | $58,563 | $13,416 | $45,147 |
Source: Public Records
Map
Nearby Homes
- 2747 Lonesome Dove Ln W
- 3142 Old Clifton Rd
- Holcombe Plan at Sycamore Ridge
- Newcastle Plan at Sycamore Ridge
- Pendleton Plan at Sycamore Ridge
- Bellamy Plan at Sycamore Ridge
- Harmony Plan at Sycamore Ridge
- 2216 Hackberry St
- 758 Oneida Dr
- 2209 Memorial Dr
- 711 Kinnane Ave
- 2200 Wrenwood Rd
- 1832 Victory Dr
- 431 Lyle Ave
- 421 Lyle Ave
- 1630 S Sweetbriar Ln
- 2229 N Hadley Rd
- 1815 Beacon St
- 1716 N Sweetbriar Ln
- 2073 Stowe Dr
- 2778 Lonesome Dove Ln E
- 2775 Lonesome Dove Ln E
- 2745 Lonesome Dove Ln E
- 1540 Hinkle Rd
- 2743 Selma Rd
- 1576 Hinkle Rd
- 2811 Lonesome Dove Ln E
- 1580 Hinkle Rd
- 1600 Hinkle Rd
- 2901 Selma Rd
- 1480 Hinkle Rd
- 2879 Selma Rd
- 2831 Selma Rd
- 2789 Selma Rd
- 2801 Selma Rd
- 1575 Hinkle Rd
- 1620 Hinkle Rd
- 2899 Selma Rd
- 2775 Selma Rd
- 2750 Lonesome Dove Ln W