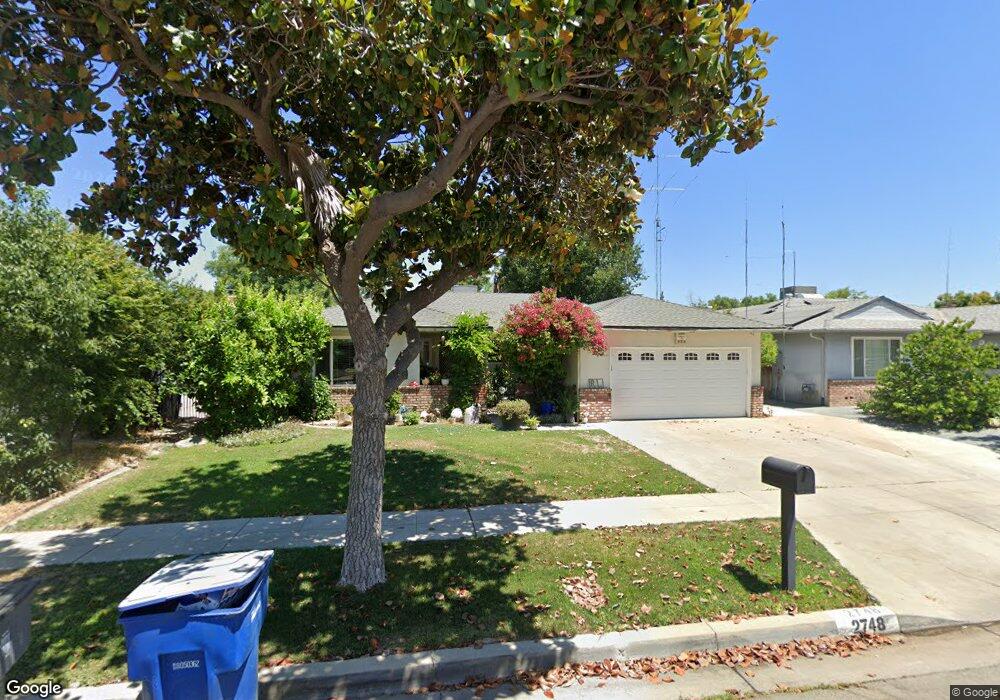
2748 W San Gabriel Ave Fresno, CA 93705
Bullard NeighborhoodEstimated Value: $363,036 - $390,000
3
Beds
2
Baths
1,643
Sq Ft
$230/Sq Ft
Est. Value
About This Home
This home is located at 2748 W San Gabriel Ave, Fresno, CA 93705 and is currently estimated at $378,009, approximately $230 per square foot. 2748 W San Gabriel Ave is a home located in Fresno County with nearby schools including Slater Elementary School, Bullard High School, and Aspen Valley Prep Academy.
Ownership History
Date
Name
Owned For
Owner Type
Purchase Details
Closed on
Mar 26, 2014
Sold by
Lozano Rudolfo N and Lozano Yolanda L
Bought by
Lozano Violeta and San Gabriel Irrevocable Trust
Current Estimated Value
Purchase Details
Closed on
Jul 1, 2010
Sold by
Lozano Rudolfo N and Lozano Yolando
Bought by
Lozano Violet and Lozano Justin
Purchase Details
Closed on
Oct 19, 2009
Sold by
Roberts Penny L
Bought by
Lozano Rudolfo N and Lozano Yolanda
Purchase Details
Closed on
May 1, 2002
Sold by
Kimura Hidemi and Kimura Marina
Bought by
Roberts Penny L
Home Financials for this Owner
Home Financials are based on the most recent Mortgage that was taken out on this home.
Original Mortgage
$60,050
Interest Rate
7.18%
Purchase Details
Closed on
Jul 17, 2001
Sold by
Kimura Karen
Bought by
Kimura Hidemi
Create a Home Valuation Report for This Property
The Home Valuation Report is an in-depth analysis detailing your home's value as well as a comparison with similar homes in the area
Home Values in the Area
Average Home Value in this Area
Purchase History
| Date | Buyer | Sale Price | Title Company |
|---|---|---|---|
| Lozano Violeta | -- | None Available | |
| Lozano Rudolfo N | -- | None Available | |
| Lozano Violet | -- | None Available | |
| Lozano Rudolfo N | $155,000 | Stewart Title Of Fresno Cnty | |
| Roberts Penny L | $120,000 | First American Title Ins Co | |
| Kimura Hidemi | -- | -- |
Source: Public Records
Mortgage History
| Date | Status | Borrower | Loan Amount |
|---|---|---|---|
| Previous Owner | Roberts Penny L | $60,050 |
Source: Public Records
Tax History Compared to Growth
Tax History
| Year | Tax Paid | Tax Assessment Tax Assessment Total Assessment is a certain percentage of the fair market value that is determined by local assessors to be the total taxable value of land and additions on the property. | Land | Improvement |
|---|---|---|---|---|
| 2025 | $2,422 | $200,064 | $38,719 | $161,345 |
| 2023 | $2,374 | $192,297 | $37,216 | $155,081 |
| 2022 | $2,340 | $188,528 | $36,487 | $152,041 |
| 2021 | $2,275 | $184,832 | $35,772 | $149,060 |
| 2020 | $2,264 | $182,938 | $35,406 | $147,532 |
| 2019 | $2,175 | $179,352 | $34,712 | $144,640 |
| 2018 | $2,214 | $175,836 | $34,032 | $141,804 |
| 2017 | $2,176 | $172,389 | $33,365 | $139,024 |
| 2016 | $2,104 | $169,010 | $32,711 | $136,299 |
| 2015 | $2,072 | $166,472 | $32,220 | $134,252 |
| 2014 | $2,031 | $163,212 | $31,589 | $131,623 |
Source: Public Records
Map
Nearby Homes
- 2457 W San Gabriel Ave
- 0 N Emerson Ave
- 2694 W Fairmont Ave
- 4936 N Holt Ave Unit 101
- 4924 N Holt Ave Unit 103
- 4960 N Holt Ave Unit 101
- 4974 N Holt Ave Unit 102
- 4707 N Kavanagh Ave
- 2151 W Pico Ave
- 2013 W Fairmont Ave
- 2553 W Scott Ave
- 5039 N Van Ness Blvd
- 2706 W Ashlan Ave Unit 94
- 2706 W Ashlan Ave Unit 200
- 2706 W Ashlan Ave Unit 323
- 2706 W Ashlan Ave Unit 113
- 2706 W Ashlan Ave Unit 48
- 2706 W Ashlan Ave Unit 158
- 2706 W Ashlan Ave Unit 197
- 2706 W Ashlan Ave Unit 11
- 2732 W San Gabriel Ave
- 2770 W San Gabriel Ave
- 2747 W Acacia Ave
- 2731 W Acacia Ave
- 2773 W Acacia Ave
- 2708 W San Gabriel Ave
- 2786 W San Gabriel Ave
- 2785 W Acacia Ave
- 2749 W San Gabriel Ave
- 2733 W San Gabriel Ave
- 2771 W San Gabriel Ave
- 2696 W San Gabriel Ave
- 2806 W San Gabriel Ave
- 2709 W San Gabriel Ave
- 2787 W San Gabriel Ave
- 2695 W Acacia Ave
- 2805 W Acacia Ave
- 2678 W San Gabriel Ave
- 2826 W San Gabriel Ave
- 2693 W San Gabriel Ave