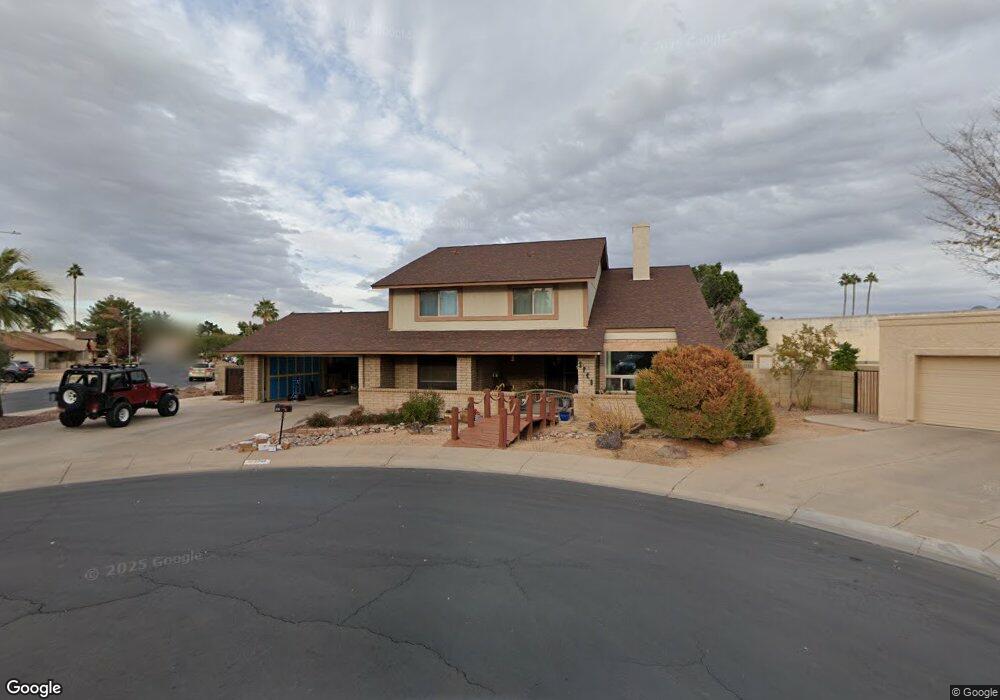
2749 S Los Altos Unit 5 Mesa, AZ 85202
Dobson NeighborhoodEstimated Value: $612,124 - $733,000
5
Beds
3
Baths
2,842
Sq Ft
$238/Sq Ft
Est. Value
About This Home
This home is located at 2749 S Los Altos Unit 5, Mesa, AZ 85202 and is currently estimated at $676,531, approximately $238 per square foot. 2749 S Los Altos Unit 5 is a home located in Maricopa County with nearby schools including Franklin at Brimhall Elementary School, Franklin Accelerated Academy Jordan Campus, and Washington Elementary School.
Ownership History
Date
Name
Owned For
Owner Type
Purchase Details
Closed on
Mar 30, 2023
Sold by
Visic John F and Visic Patrice R
Bought by
Visic Family Trust
Current Estimated Value
Purchase Details
Closed on
Jun 19, 2003
Sold by
Humbert Steven D and Humbert Rebecca C
Bought by
Visic John F and Visic Patrice R
Home Financials for this Owner
Home Financials are based on the most recent Mortgage that was taken out on this home.
Original Mortgage
$168,600
Interest Rate
5.37%
Mortgage Type
New Conventional
Purchase Details
Closed on
Jan 18, 1996
Sold by
Williams John F and Williams Nancy Lynn
Bought by
Humbert Steven D and Humbert Rebecca C
Home Financials for this Owner
Home Financials are based on the most recent Mortgage that was taken out on this home.
Original Mortgage
$152,435
Interest Rate
7%
Mortgage Type
New Conventional
Create a Home Valuation Report for This Property
The Home Valuation Report is an in-depth analysis detailing your home's value as well as a comparison with similar homes in the area
Home Values in the Area
Average Home Value in this Area
Purchase History
| Date | Buyer | Sale Price | Title Company |
|---|---|---|---|
| Visic Family Trust | -- | -- | |
| Visic John F | $212,000 | Equity Title Agency Inc | |
| Humbert Steven D | $165,000 | Fidelity Title |
Source: Public Records
Mortgage History
| Date | Status | Borrower | Loan Amount |
|---|---|---|---|
| Previous Owner | Visic John F | $168,600 | |
| Previous Owner | Humbert Steven D | $152,435 |
Source: Public Records
Tax History Compared to Growth
Tax History
| Year | Tax Paid | Tax Assessment Tax Assessment Total Assessment is a certain percentage of the fair market value that is determined by local assessors to be the total taxable value of land and additions on the property. | Land | Improvement |
|---|---|---|---|---|
| 2025 | $2,494 | $30,027 | -- | -- |
| 2024 | $2,521 | $28,597 | -- | -- |
| 2023 | $2,521 | $47,510 | $9,500 | $38,010 |
| 2022 | $2,466 | $35,400 | $7,080 | $28,320 |
| 2021 | $2,533 | $33,970 | $6,790 | $27,180 |
| 2020 | $2,499 | $32,710 | $6,540 | $26,170 |
| 2019 | $2,315 | $30,480 | $6,090 | $24,390 |
| 2018 | $2,211 | $28,960 | $5,790 | $23,170 |
| 2017 | $2,141 | $28,180 | $5,630 | $22,550 |
| 2016 | $2,102 | $30,130 | $6,020 | $24,110 |
| 2015 | $1,985 | $27,520 | $5,500 | $22,020 |
Source: Public Records
Map
Nearby Homes
- 2043 W Nopal Ave
- 2309 W Naranja Ave
- 2554 S Salida Del Sol
- 2030 W Portobello Ave
- 1910 W Onza Ave
- 2552 S Playa
- 2637 S El Paradiso
- 2958 S El Paradiso
- 1853 W Plata Ave
- 2722 S Pennington
- 2937 S Pennington
- 2334 W Peralta Ave
- 2559 W Olla Cir
- 2453 W Pecos Ave
- 2334 W Lobo Ave
- 2524 S El Paradiso Unit 22
- 2524 S El Paradiso Unit 32
- 2524 S El Paradiso Unit 50
- 2642 W Onza Ave
- 2628 W Mendoza Cir
- 2741 S Los Altos
- 2757 S Los Altos
- 2744 S Los Altos
- 2733 S Los Altos
- 2139 W Naranja Ave Unit 5
- 2734 S Los Altos
- 2147 W Naranja Ave
- 2746 S Paseo Loma
- 2141 W Nopal Ave
- 2158 W Naranja Ave Unit 5
- 2137 W Nopal Ave
- 2725 S Los Altos
- 2726 S Los Altos
- 2155 W Naranja Ave
- 2742 S Paseo Loma
- 2120 W Guadalupe Rd
- 2133 W Nopal Ave
- 2214 W Naranja Ave Unit 5
- 2738 S Paseo Loma
- 2215 W Nopal Cir