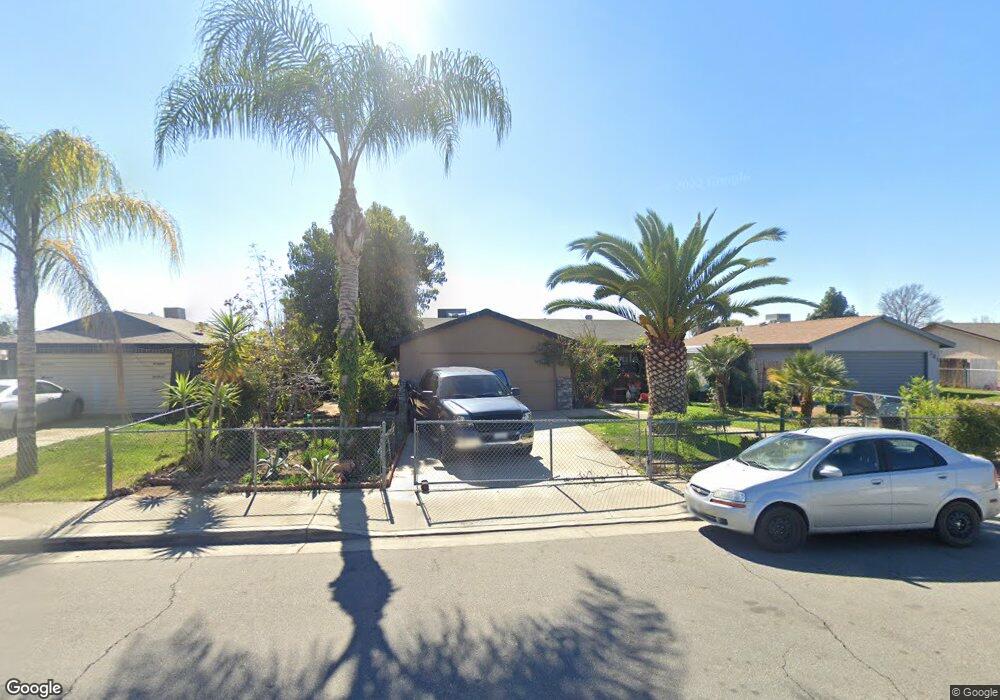
275 Atkinson Ave Shafter, CA 93263
Estimated Value: $221,000 - $332,000
3
Beds
2
Baths
1,040
Sq Ft
$274/Sq Ft
Est. Value
About This Home
This home is located at 275 Atkinson Ave, Shafter, CA 93263 and is currently estimated at $285,190, approximately $274 per square foot. 275 Atkinson Ave is a home located in Kern County with nearby schools including Golden Oak Elementary School, Shafter High School, and Grow Academy Shafter.
Ownership History
Date
Name
Owned For
Owner Type
Purchase Details
Closed on
Dec 8, 2006
Sold by
Velarde Maria Carmen J
Bought by
Velarde Rudy G
Current Estimated Value
Home Financials for this Owner
Home Financials are based on the most recent Mortgage that was taken out on this home.
Original Mortgage
$157,500
Outstanding Balance
$94,218
Interest Rate
6.32%
Mortgage Type
New Conventional
Estimated Equity
$190,972
Purchase Details
Closed on
Aug 3, 2005
Sold by
Velarde Rudy G
Bought by
Velarde Rudy G and Velarde Maria Carmen J
Home Financials for this Owner
Home Financials are based on the most recent Mortgage that was taken out on this home.
Original Mortgage
$144,000
Interest Rate
8.29%
Mortgage Type
New Conventional
Purchase Details
Closed on
Mar 31, 1995
Sold by
Faatz Peter Jan and Faatz Jan C
Bought by
Velarde Rudy G and Velarde Maria Carmen J
Home Financials for this Owner
Home Financials are based on the most recent Mortgage that was taken out on this home.
Original Mortgage
$52,100
Interest Rate
8.6%
Create a Home Valuation Report for This Property
The Home Valuation Report is an in-depth analysis detailing your home's value as well as a comparison with similar homes in the area
Home Values in the Area
Average Home Value in this Area
Purchase History
We collect this data history from publicly available records. To have your information removed, we recommend requesting removal directly through your county’s website.
| Date | Buyer | Sale Price | Title Company |
|---|---|---|---|
| Velarde Rudy G | -- | Financial Title Company | |
| Velarde Rudy G | -- | -- | |
| Velarde Rudy G | -- | Financial Title Company | |
| Velarde Rudy G | $69,500 | Commonwealth Title Co |
Source: Public Records
Mortgage History
We collect this data history from publicly available records. To have your information removed, we recommend requesting removal directly through your county’s website.
| Date | Status | Borrower | Loan Amount |
|---|---|---|---|
| Open | Velarde Rudy G | $157,500 | |
| Closed | Velarde Rudy G | $144,000 | |
| Closed | Velarde Rudy G | $52,100 | |
| Closed | Velarde Rudy G | $10,425 |
Source: Public Records
Tax History
| Year | Tax Paid | Tax Assessment Tax Assessment Total Assessment is a certain percentage of the fair market value that is determined by local assessors to be the total taxable value of land and additions on the property. | Land | Improvement |
|---|---|---|---|---|
| 2025 | $1,616 | $116,698 | $33,576 | $83,122 |
| 2024 | $1,616 | $114,411 | $32,918 | $81,493 |
| 2023 | $1,564 | $112,169 | $32,273 | $79,896 |
| 2022 | $1,501 | $109,971 | $31,641 | $78,330 |
| 2021 | $1,439 | $107,816 | $31,021 | $76,795 |
| 2020 | $1,394 | $106,711 | $30,703 | $76,008 |
| 2019 | $1,391 | $106,711 | $30,703 | $76,008 |
| 2018 | $1,340 | $102,568 | $29,511 | $73,057 |
| 2017 | $1,332 | $100,558 | $28,933 | $71,625 |
| 2016 | $1,258 | $98,587 | $28,366 | $70,221 |
| 2015 | $1,225 | $97,107 | $27,940 | $69,167 |
| 2014 | $1,066 | $85,000 | $21,000 | $64,000 |
Source: Public Records
Map
Nearby Homes
- 344 Atkinson Ave
- 144 Rodriguez Ave
- 9211 Woodbrook Dr
- 700 S Shafter Ave Unit 115
- 700 S Shafter Ave Unit 20
- 700 S Shefter Ave #36
- 408 W Euclid Ave
- 472 W Euclid Ave
- 187 E Orange Ave
- 236 Trevino Terrace
- 285 E Ash Ave
- 445 Atlantic Ave
- 249 E Marengo Ave
- 30348 Riverside St
- 209 Pacific Ave
- 208 California Ave
- 360 E Orange Ave
- 890 W Los Angeles Ave
- 611 Ohanneson Ave
- 0 Lerdo Hwy Unit 202600415
- 301 Atkinson Ave
- 269 Atkinson Ave
- 307 Atkinson Ave
- 263 Atkinson Ave
- 274 Olson Ave
- 300 Olson Ave
- 268 Olson Ave
- 315 Atkinson Ave
- 274 Atkinson Ave
- 257 Atkinson Ave
- 306 Olson Ave
- 300 Atkinson Ave
- 268 Atkinson Ave
- 306 Atkinson Ave
- 262 Atkinson Ave
- 314 Olson Ave
- 256 Olson Ave
- 321 Atkinson Ave
- 251 Atkinson Ave
- 314 Atkinson Ave
Your Personal Tour Guide
Ask me questions while you tour the home.