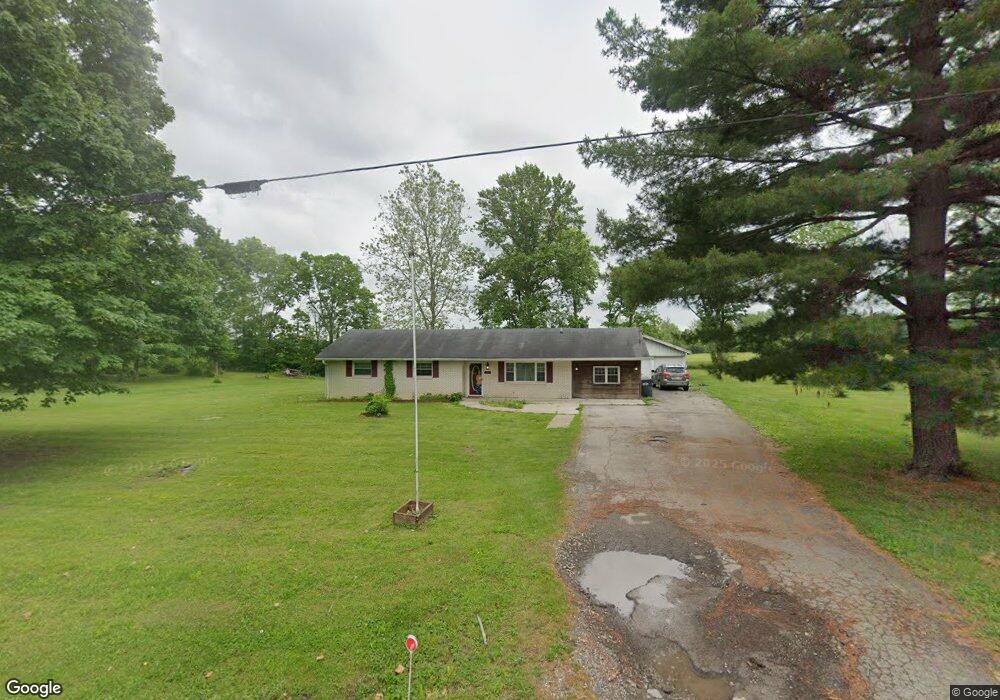
275 E Edgewood Dr Unit Springport Springport, IN 47386
Estimated Value: $217,000 - $249,000
3
Beds
2
Baths
1,581
Sq Ft
$146/Sq Ft
Est. Value
About This Home
This home is located at 275 E Edgewood Dr Unit Springport, Springport, IN 47386 and is currently estimated at $230,533, approximately $145 per square foot. 275 E Edgewood Dr Unit Springport is a home located in Henry County with nearby schools including Blue River Valley Elementary School and Blue River Valley Junior/Senior High School.
Ownership History
Date
Name
Owned For
Owner Type
Purchase Details
Closed on
Apr 13, 2018
Sold by
Perdue
Bought by
Turner Turner
Current Estimated Value
Home Financials for this Owner
Home Financials are based on the most recent Mortgage that was taken out on this home.
Original Mortgage
$118,945
Outstanding Balance
$104,677
Interest Rate
5.5%
Mortgage Type
FHA
Estimated Equity
$125,856
Purchase Details
Closed on
Nov 1, 2014
Sold by
Perdue Matthew M
Bought by
Turner Tommy and Turner Michelle
Purchase Details
Closed on
Mar 2, 2013
Sold by
Perdue Matthew and Perdue Maren
Bought by
Silvers Joshua and Silvers Charity
Purchase Details
Closed on
Nov 16, 2005
Sold by
Perdue Michael E and Perdue Laura M
Bought by
Perdue Matthew M and Perdue Maren J
Home Financials for this Owner
Home Financials are based on the most recent Mortgage that was taken out on this home.
Original Mortgage
$113,000
Interest Rate
6.13%
Mortgage Type
New Conventional
Create a Home Valuation Report for This Property
The Home Valuation Report is an in-depth analysis detailing your home's value as well as a comparison with similar homes in the area
Home Values in the Area
Average Home Value in this Area
Purchase History
| Date | Buyer | Sale Price | Title Company |
|---|---|---|---|
| Turner Turner | $115,000 | -- | |
| Turner Tommy J | $115,000 | In Title Company | |
| Turner Tommy | $115,000 | -- | |
| Silvers Joshua | $115,000 | None Available | |
| Perdue Matthew M | -- | None Available |
Source: Public Records
Mortgage History
| Date | Status | Borrower | Loan Amount |
|---|---|---|---|
| Open | Turner Tommy J | $118,945 | |
| Previous Owner | Perdue Matthew M | $113,000 | |
| Closed | Silvers Joshua | $0 |
Source: Public Records
Tax History Compared to Growth
Tax History
| Year | Tax Paid | Tax Assessment Tax Assessment Total Assessment is a certain percentage of the fair market value that is determined by local assessors to be the total taxable value of land and additions on the property. | Land | Improvement |
|---|---|---|---|---|
| 2024 | $954 | $161,600 | $21,400 | $140,200 |
| 2023 | $737 | $143,500 | $21,400 | $122,100 |
| 2022 | $1,339 | $136,500 | $17,100 | $119,400 |
| 2021 | $1,189 | $122,400 | $17,100 | $105,300 |
| 2020 | $1,275 | $125,900 | $17,100 | $108,800 |
| 2019 | $1,081 | $123,300 | $17,100 | $106,200 |
| 2018 | $999 | $120,000 | $15,500 | $104,500 |
| 2017 | $913 | $118,100 | $15,500 | $102,600 |
| 2016 | $832 | $115,100 | $15,100 | $100,000 |
| 2014 | $876 | $111,600 | $14,600 | $97,000 |
| 2013 | $876 | $110,100 | $15,100 | $95,000 |
Source: Public Records
Map
Nearby Homes
- 6990 N Hickory Ln
- 200 S East St
- 208 W Main St
- 6902 N County Road 175 E
- 9029 N State Road 3
- 208 W Main St
- 180 S Summit St
- 400 E County Road 775 S
- 206 W Main St
- 106 Bluebird Ln
- 11501 S County Road 200 W
- 11501 S County Road 200 W Roads
- 0 W County Road 600 N
- **** N County Road 400 W
- 501 S Hardacre Ct
- 0000 N Buck Creek Pike
- 11559 S County Road 300 W
- 1401 W County Road 600 S
- 3198 N County Road 300 W
- 3300 E Indian Hill Dr
- 275 E Edgewood Dr
- 265 E Edgewood Dr
- 293 E Edgewood Dr
- 293 E Edgewood Dr Unit Springport
- 215 E Edgewood Dr
- 215 E Edgewood Dr Unit Springport
- 268 E Edgewood Dr
- 250 E Edgewood Dr
- 6977 N Orchard Dr
- 231 E Sycamore Dr
- 231 E Sycamore Dr Unit Springport
- 6966 N Orchard Dr
- 189 E Edgewood Dr
- 221 E Sycamore Dr
- 188 E Edgewood Dr
- 270 E Sycamore Dr
- 196 E Sycamore Dr
- 157 E Edgewood Dr
- 157 E Edgewood Dr Unit Springport
- 175 E Sycamore Dr