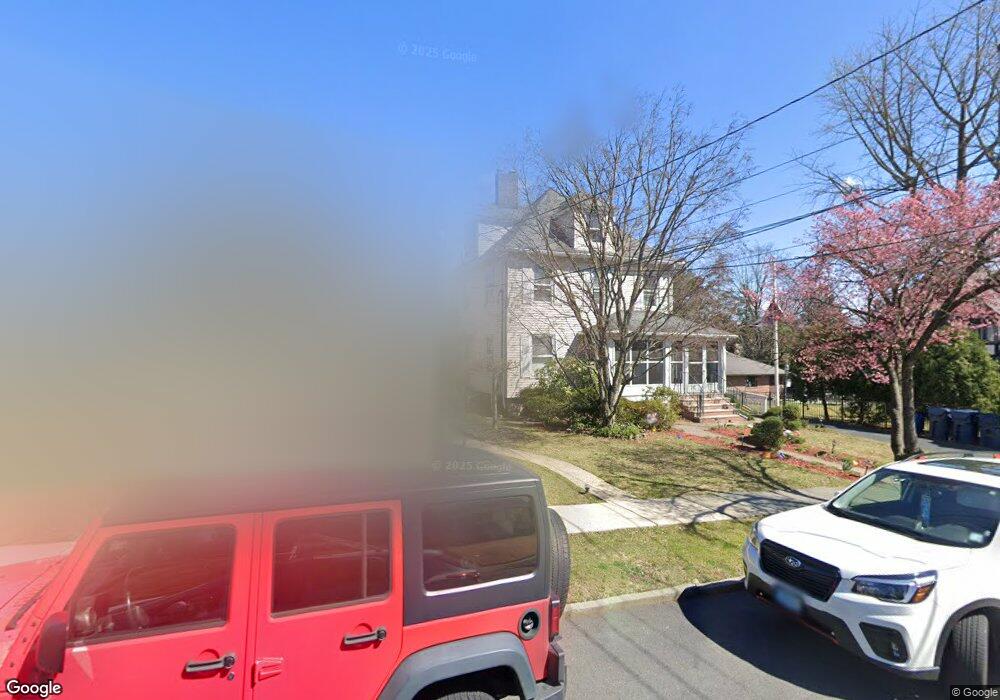
275 Euclid Ave Hackensack, NJ 07601
Estimated Value: $528,952 - $655,000
2
Beds
1
Bath
1,283
Sq Ft
$451/Sq Ft
Est. Value
About This Home
This home is located at 275 Euclid Ave, Hackensack, NJ 07601 and is currently estimated at $578,238, approximately $450 per square foot. 275 Euclid Ave is a home located in Bergen County with nearby schools including Hackensack High School and Bergen County Christian Academy.
Ownership History
Date
Name
Owned For
Owner Type
Purchase Details
Closed on
Jul 18, 2023
Sold by
Guzman Amster
Bought by
Diaz Kelvin and Andrade-Diaz Angela
Current Estimated Value
Home Financials for this Owner
Home Financials are based on the most recent Mortgage that was taken out on this home.
Original Mortgage
$308,650
Interest Rate
5.63%
Mortgage Type
New Conventional
Purchase Details
Closed on
Jul 15, 2020
Sold by
Druitt Tamara
Bought by
Guzman Amster
Home Financials for this Owner
Home Financials are based on the most recent Mortgage that was taken out on this home.
Original Mortgage
$204,250
Interest Rate
2.9%
Mortgage Type
New Conventional
Purchase Details
Closed on
Jan 1, 2007
Sold by
Lombardelli Lucinda M
Bought by
Druitt Tamara
Home Financials for this Owner
Home Financials are based on the most recent Mortgage that was taken out on this home.
Original Mortgage
$60,000
Interest Rate
6.31%
Mortgage Type
Purchase Money Mortgage
Create a Home Valuation Report for This Property
The Home Valuation Report is an in-depth analysis detailing your home's value as well as a comparison with similar homes in the area
Home Values in the Area
Average Home Value in this Area
Purchase History
| Date | Buyer | Sale Price | Title Company |
|---|---|---|---|
| Diaz Kelvin | $395,000 | None Listed On Document | |
| Guzman Amster | $215,000 | Clear Skies Title Agency | |
| Druitt Tamara | $347,000 | -- |
Source: Public Records
Mortgage History
| Date | Status | Borrower | Loan Amount |
|---|---|---|---|
| Open | Diaz Kelvin | $308,650 | |
| Previous Owner | Diaz Kelvin | $308,650 | |
| Previous Owner | Guzman Amster | $204,250 | |
| Previous Owner | Druitt Tamara | $60,000 |
Source: Public Records
Tax History Compared to Growth
Tax History
| Year | Tax Paid | Tax Assessment Tax Assessment Total Assessment is a certain percentage of the fair market value that is determined by local assessors to be the total taxable value of land and additions on the property. | Land | Improvement |
|---|---|---|---|---|
| 2025 | $9,425 | $308,400 | $214,100 | $94,300 |
| 2024 | $8,879 | $308,400 | $214,100 | $94,300 |
| 2023 | $8,428 | $308,400 | $214,100 | $94,300 |
| 2022 | $8,428 | $300,800 | $207,100 | $93,700 |
| 2021 | $8,664 | $258,000 | $177,800 | $80,200 |
| 2020 | $8,537 | $258,000 | $177,800 | $80,200 |
| 2019 | $8,533 | $254,200 | $175,300 | $78,900 |
| 2018 | $8,536 | $250,100 | $171,800 | $78,300 |
| 2017 | $8,411 | $246,300 | $169,300 | $77,000 |
| 2016 | $7,942 | $235,100 | $159,300 | $75,800 |
| 2015 | $7,501 | $214,300 | $155,400 | $58,900 |
| 2014 | $7,119 | $214,300 | $155,400 | $58,900 |
Source: Public Records
Map
Nearby Homes
- 290 Clinton Place
- 378 Lookout Ave
- 246 Ross Ave
- 409 W Anderson St
- 178 Fairmount Ave
- 420 Passaic St Unit 2G
- 303 Hamilton Place Unit D4
- 81 Fairmount Ave
- 403 Summit Ave
- 140 Euclid Ave Unit 4G
- 140 Euclid Ave Unit 1H
- 67 Spring Valley Ave
- 30 Clarendon Place
- 150 Grand Ave Unit 1A
- 240 Hamilton Place
- 423 the Esplanade
- 208 Anderson St Unit S4F
- 395 2nd St
- 165 Pine St
- 344 Prospect Ave Unit 4C
- 279 Euclid Ave
- 271 Euclid Ave
- 283 Euclid Ave
- 300 Clinton Place
- 287 Euclid Ave
- 261 Euclid Ave
- 304 Clinton Place
- 284 Clinton Place
- 278 Euclid Ave
- 268 Euclid Ave
- 280 Euclid Ave
- 264 Euclid Ave
- 257 Euclid Ave
- 286 Euclid Ave
- 318 Clinton Place
- 297 Euclid Ave
- 260 Euclid Ave
- 280 Clinton Place
- 290 Euclid Ave
- 256 Euclid Ave