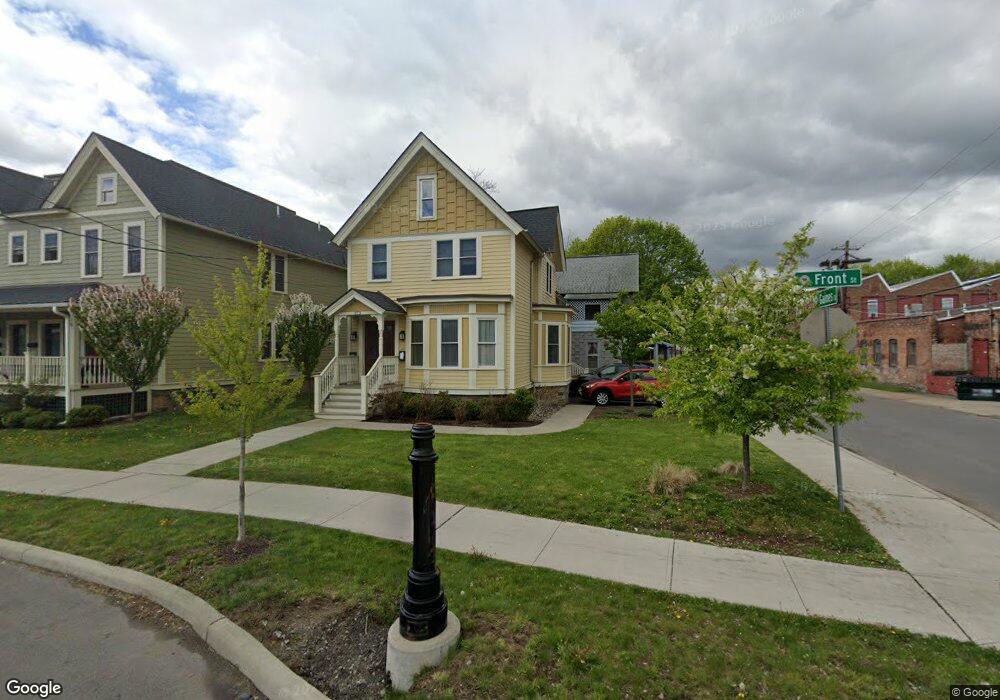
275 Front St Binghamton, NY 13905
First Ward NeighborhoodEstimated Value: $109,000 - $313,000
Studio
2
Baths
--
Sq Ft
1,133
Sq Ft Lot
About This Home
This home is located at 275 Front St, Binghamton, NY 13905 and is currently estimated at $201,000. 275 Front St is a home located in Broome County with nearby schools including Binghamton High School, Woodrow Wilson Elementary School, and West Middle School.
Ownership History
Date
Name
Owned For
Owner Type
Purchase Details
Closed on
Mar 18, 2015
Sold by
Trout Brook Housing Devel
Bought by
Binghamton Gateway Housing
Current Estimated Value
Purchase Details
Closed on
Mar 7, 2013
Sold by
City Of Binghamton
Bought by
Trout Brook Housing Development Fund Cor
Purchase Details
Closed on
Jun 30, 2011
Sold by
The County Of Broome
Bought by
City Of Binghamton
Purchase Details
Closed on
Feb 4, 2011
Sold by
Keough Kevin P
Bought by
County Of Broome
Purchase Details
Closed on
Mar 18, 2004
Sold by
Kirkpatrick Clifford
Bought by
Lurcock Connie
Create a Home Valuation Report for This Property
The Home Valuation Report is an in-depth analysis detailing your home's value as well as a comparison with similar homes in the area
Home Values in the Area
Average Home Value in this Area
Purchase History
| Date | Buyer | Sale Price | Title Company |
|---|---|---|---|
| Binghamton Gateway Housing | $200 | Paul M. Price | |
| Binghamton Gateway Housing Development F | $200 | None Available | |
| Trout Brook Housing Development Fund Cor | $200 | None Available | |
| City Of Binghamton | -- | None Available | |
| County Of Broome | -- | None Available | |
| Lurcock Connie | -- | -- |
Source: Public Records
Tax History
| Year | Tax Paid | Tax Assessment Tax Assessment Total Assessment is a certain percentage of the fair market value that is determined by local assessors to be the total taxable value of land and additions on the property. | Land | Improvement |
|---|---|---|---|---|
| 2024 | $2,888 | $29,300 | $29,300 | $0 |
| 2023 | $2,835 | $29,300 | $29,300 | $0 |
| 2022 | $2,768 | $29,300 | $29,300 | $0 |
| 2021 | $2,737 | $29,300 | $29,300 | $0 |
| 2020 | $1,810 | $29,300 | $29,300 | $0 |
| 2019 | $924 | $29,300 | $25,700 | $3,600 |
| 2018 | $1,765 | $29,300 | $25,700 | $3,600 |
| 2017 | $1,774 | $29,300 | $25,700 | $3,600 |
| 2016 | $2,170 | $35,700 | $35,700 | $0 |
| 2015 | $2,275 | $35,700 | $35,700 | $0 |
| 2014 | $2,275 | $17,600 | $17,600 | $0 |
Source: Public Records
Map
Nearby Homes
Your Personal Tour Guide
Ask me questions while you tour the home.