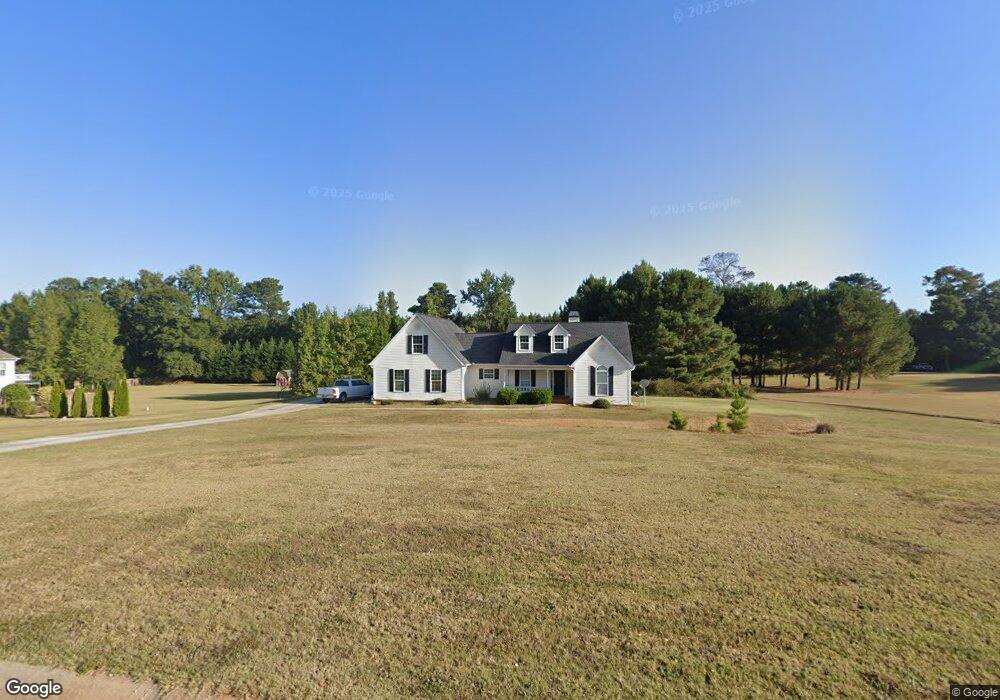
275 Ivy Cir Unit 2 Concord, GA 30206
Estimated Value: $321,000 - $428,000
3
Beds
2
Baths
2,343
Sq Ft
$158/Sq Ft
Est. Value
About This Home
This home is located at 275 Ivy Cir Unit 2, Concord, GA 30206 and is currently estimated at $370,775, approximately $158 per square foot. 275 Ivy Cir Unit 2 is a home located in Pike County with nearby schools including Pike County Primary School, Pike County Elementary School, and Pike County Middle School.
Ownership History
Date
Name
Owned For
Owner Type
Purchase Details
Closed on
Jun 5, 2020
Sold by
Huddleston Jennifer M
Bought by
Huddleston Jennifer and Huddleston Nathaniel
Current Estimated Value
Home Financials for this Owner
Home Financials are based on the most recent Mortgage that was taken out on this home.
Original Mortgage
$112,000
Outstanding Balance
$99,279
Interest Rate
3.2%
Mortgage Type
New Conventional
Estimated Equity
$271,496
Purchase Details
Closed on
Jan 19, 2012
Bought by
Huddleston Jennifer M
Purchase Details
Closed on
Oct 1, 2011
Sold by
National City Mtg
Bought by
Federal National Mtg
Purchase Details
Closed on
Jun 7, 2011
Sold by
National City Mtg
Bought by
Federal National Mtg
Purchase Details
Closed on
May 10, 2005
Sold by
Allen Jimmy R
Bought by
Phillips Brenda S
Home Financials for this Owner
Home Financials are based on the most recent Mortgage that was taken out on this home.
Original Mortgage
$188,100
Interest Rate
9.88%
Mortgage Type
New Conventional
Purchase Details
Closed on
Nov 5, 2004
Sold by
Davis Enterprises Inc
Bought by
Allen Jimmy R
Create a Home Valuation Report for This Property
The Home Valuation Report is an in-depth analysis detailing your home's value as well as a comparison with similar homes in the area
Home Values in the Area
Average Home Value in this Area
Purchase History
| Date | Buyer | Sale Price | Title Company |
|---|---|---|---|
| Huddleston Jennifer | -- | -- | |
| Huddleston Jennifer M | $94,900 | -- | |
| Federal National Mtg | $217,675 | -- | |
| Federal National Mtg | $217,675 | -- | |
| National City Mtg | $217,675 | -- | |
| Phillips Brenda S | $198,000 | -- | |
| Allen Jimmy R | $29,000 | -- |
Source: Public Records
Mortgage History
| Date | Status | Borrower | Loan Amount |
|---|---|---|---|
| Open | Huddleston Jennifer | $112,000 | |
| Previous Owner | Phillips Brenda S | $188,100 |
Source: Public Records
Tax History Compared to Growth
Tax History
| Year | Tax Paid | Tax Assessment Tax Assessment Total Assessment is a certain percentage of the fair market value that is determined by local assessors to be the total taxable value of land and additions on the property. | Land | Improvement |
|---|---|---|---|---|
| 2024 | $3,024 | $126,579 | $18,800 | $107,779 |
| 2023 | $3,618 | $126,579 | $18,800 | $107,779 |
| 2022 | $2,456 | $86,532 | $14,400 | $72,132 |
| 2021 | $2,541 | $86,532 | $14,400 | $72,132 |
| 2020 | $2,571 | $86,532 | $14,400 | $72,132 |
| 2019 | $2,214 | $66,032 | $6,800 | $59,232 |
| 2018 | $2,216 | $66,032 | $6,800 | $59,232 |
| 2017 | $2,198 | $66,032 | $6,800 | $59,232 |
| 2016 | $1,746 | $56,788 | $5,848 | $50,940 |
| 2015 | $1,661 | $56,788 | $5,848 | $50,940 |
| 2014 | $1,685 | $56,788 | $5,848 | $50,940 |
| 2013 | -- | $56,787 | $5,848 | $50,939 |
Source: Public Records
Map
Nearby Homes
- 2192 Gaulding Rd
- 965 Hood Rd
- 2337 Hollonville Rd
- 481 Turner Rd
- 4170 Hollonville Rd
- 5548 Georgia 362
- 223 Ward Rd
- 2246 Concord Rd
- 1881 Beeks Rd
- 4091 Hollonville Rd
- 59 Red Ln
- 2310 Hollonville Rd
- 0 Blackmon Rd
- 3.39 ACRES Caldwell Bridge Rd
- 708 Traveler Ln
- 708 Traveler Ln Unit LOT 54
- 971 Traveler Ln Unit 43
- 1003 Traveler Ln Unit 44
- 851 Traveler Ln Unit 39
- 861 Traveler Ln Unit 40