Estimated Value: $106,000 - $127,000
2
Beds
1
Bath
750
Sq Ft
$158/Sq Ft
Est. Value
About This Home
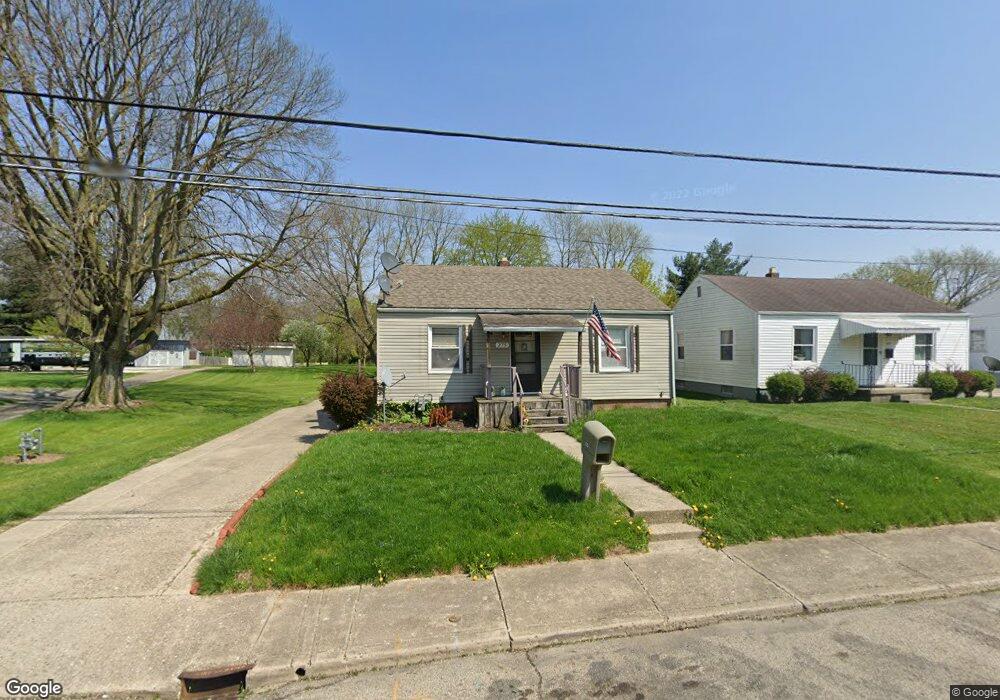
This home is located at 275 Linden Ave, Piqua, OH 45356 and is currently estimated at $118,507, approximately $158 per square foot. 275 Linden Ave is a home located in Miami County with nearby schools including Piqua Junior High School, Piqua High School, and Nicholas School.
Ownership History
Date
Name
Owned For
Owner Type
Purchase Details
Closed on
Mar 11, 2019
Sold by
Hall Frederick L and Hall Frederick Lee
Bought by
Komerstone Holdings Llc
Current Estimated Value
Purchase Details
Closed on
Nov 2, 2016
Sold by
Hall Kelley R
Bought by
Frederick L Hall
Home Financials for this Owner
Home Financials are based on the most recent Mortgage that was taken out on this home.
Interest Rate
3.47%
Purchase Details
Closed on
Jun 4, 2007
Sold by
Sorrell James W
Bought by
Sorrell John and Sorrell Paula
Home Financials for this Owner
Home Financials are based on the most recent Mortgage that was taken out on this home.
Original Mortgage
$79,200
Interest Rate
6.22%
Mortgage Type
New Conventional
Purchase Details
Closed on
Sep 2, 1999
Sold by
Mowery Robert E and Mowery Brenda S
Bought by
Sorrell James W
Home Financials for this Owner
Home Financials are based on the most recent Mortgage that was taken out on this home.
Original Mortgage
$83,130
Interest Rate
7.59%
Mortgage Type
VA
Purchase Details
Closed on
Aug 16, 1995
Sold by
Ross Jeannette I
Bought by
Mowery Brenda S and Mowery Robert E
Create a Home Valuation Report for This Property
The Home Valuation Report is an in-depth analysis detailing your home's value as well as a comparison with similar homes in the area
Home Values in the Area
Average Home Value in this Area
Purchase History
| Date | Buyer | Sale Price | Title Company |
|---|---|---|---|
| Komerstone Holdings Llc | -- | None Available | |
| Frederick L Hall | -- | -- | |
| Sorrell John | $88,000 | -- | |
| Sorrell James W | $81,500 | -- | |
| Mowery Brenda S | $60,000 | -- |
Source: Public Records
Mortgage History
| Date | Status | Borrower | Loan Amount |
|---|---|---|---|
| Previous Owner | Sorrell James W | -- | |
| Previous Owner | Sorrell James W | $79,200 | |
| Previous Owner | Sorrell James W | $83,130 |
Source: Public Records
Tax History Compared to Growth
Tax History
| Year | Tax Paid | Tax Assessment Tax Assessment Total Assessment is a certain percentage of the fair market value that is determined by local assessors to be the total taxable value of land and additions on the property. | Land | Improvement |
|---|---|---|---|---|
| 2024 | $1,179 | $27,970 | $6,340 | $21,630 |
| 2023 | $1,179 | $27,970 | $6,340 | $21,630 |
| 2022 | $1,200 | $27,970 | $6,340 | $21,630 |
| 2021 | $969 | $20,720 | $4,690 | $16,030 |
| 2020 | $952 | $20,720 | $4,690 | $16,030 |
| 2019 | $958 | $20,720 | $4,690 | $16,030 |
| 2018 | $440 | $9,070 | $4,730 | $4,340 |
| 2017 | $445 | $9,070 | $4,730 | $4,340 |
| 2016 | $441 | $9,070 | $4,730 | $4,340 |
| 2015 | $433 | $8,720 | $4,550 | $4,170 |
| 2014 | $433 | $8,720 | $4,550 | $4,170 |
| 2013 | $1,096 | $22,610 | $4,550 | $18,060 |
Source: Public Records
Map
Nearby Homes