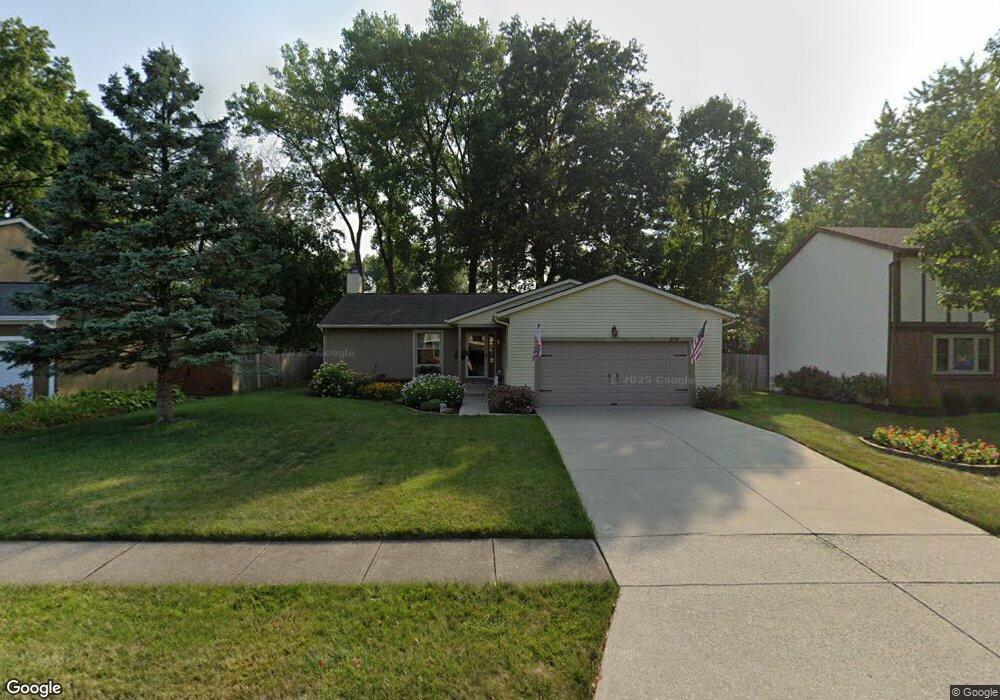
275 Maple Ave Pickerington, OH 43147
Estimated Value: $307,000 - $350,000
3
Beds
2
Baths
1,800
Sq Ft
$179/Sq Ft
Est. Value
About This Home
This home is located at 275 Maple Ave, Pickerington, OH 43147 and is currently estimated at $322,020, approximately $178 per square foot. 275 Maple Ave is a home located in Fairfield County with nearby schools including Pickerington Elementary School, Pickerington Ridgeview Junior High School, and Diley Middle School.
Ownership History
Date
Name
Owned For
Owner Type
Purchase Details
Closed on
Sep 17, 2010
Sold by
Kile Lydia L and Appel Lydia K
Bought by
Johnson John C and Johnson Linda Kay
Current Estimated Value
Home Financials for this Owner
Home Financials are based on the most recent Mortgage that was taken out on this home.
Original Mortgage
$101,200
Outstanding Balance
$65,806
Interest Rate
4.45%
Mortgage Type
New Conventional
Estimated Equity
$256,214
Purchase Details
Closed on
Apr 5, 2002
Sold by
Cassidy Ronald A
Bought by
Appel Lydia K
Purchase Details
Closed on
Aug 13, 1999
Sold by
Yates William A
Bought by
Cassidy Ronald A and Cassidy Karen S
Home Financials for this Owner
Home Financials are based on the most recent Mortgage that was taken out on this home.
Original Mortgage
$134,231
Interest Rate
7.77%
Mortgage Type
FHA
Purchase Details
Closed on
Nov 1, 1990
Create a Home Valuation Report for This Property
The Home Valuation Report is an in-depth analysis detailing your home's value as well as a comparison with similar homes in the area
Home Values in the Area
Average Home Value in this Area
Purchase History
| Date | Buyer | Sale Price | Title Company |
|---|---|---|---|
| Johnson John C | $126,500 | Talon Title | |
| Appel Lydia K | $148,500 | -- | |
| Cassidy Ronald A | $134,300 | -- | |
| -- | $94,800 | -- |
Source: Public Records
Mortgage History
| Date | Status | Borrower | Loan Amount |
|---|---|---|---|
| Open | Johnson John C | $101,200 | |
| Previous Owner | Cassidy Ronald A | $134,231 | |
| Closed | Appel Lydia K | -- |
Source: Public Records
Tax History
| Year | Tax Paid | Tax Assessment Tax Assessment Total Assessment is a certain percentage of the fair market value that is determined by local assessors to be the total taxable value of land and additions on the property. | Land | Improvement |
|---|---|---|---|---|
| 2025 | $9,011 | $99,480 | $23,140 | $76,340 |
| 2024 | $9,011 | $73,200 | $12,720 | $60,480 |
| 2023 | $3,019 | $73,200 | $12,720 | $60,480 |
| 2022 | $3,048 | $73,200 | $12,720 | $60,480 |
| 2021 | $2,731 | $57,930 | $11,570 | $46,360 |
| 2020 | $2,744 | $57,930 | $11,570 | $46,360 |
| 2019 | $2,779 | $57,930 | $11,570 | $46,360 |
| 2018 | $2,084 | $43,020 | $11,570 | $31,450 |
| 2017 | $2,087 | $40,900 | $9,770 | $31,130 |
| 2016 | $2,076 | $40,900 | $9,770 | $31,130 |
| 2015 | $2,020 | $38,320 | $9,770 | $28,550 |
| 2014 | $1,995 | $38,320 | $9,770 | $28,550 |
| 2013 | $1,995 | $38,320 | $9,770 | $28,550 |
Source: Public Records
Map
Nearby Homes
- 292 Maple Place
- 195 Parkwood Ave
- 368 Colony Park Dr
- 495 Courtland Ln
- 477 Courtland Ln
- 192 England St
- 353 Florence Dr
- 6448 Bemington Trai
- 148 Georges Creek Dr
- 559 Cherry Hill Dr
- 176 Knights Bridge Dr E
- 136 Pioneer Cir
- 760 N Starr Dr
- 0 W Columbus St Unit 5152884
- 0 W Columbus St Unit 225032912
- 43 Langtree Dr
- 780 Diley Rd
- 128 Jamie Lynn Cir Unit 128
- 10367 Long Nw Rd
- 692 Hill Rd N
- 285 Maple Ave
- 265 Maple Ave
- 254 Parkwood Ave
- 262 Parkwood Ave
- 255 Maple Ave
- 295 Maple Ave
- 244 Parkwood Ave
- 272 Parkwood Ave
- 270 Maple Ave
- 236 Parkwood Ave
- 260 Maple Ave
- 305 Maple Ave
- 245 Maple Ave
- 250 Maple Ave
- 280 Parkwood Ave
- 226 Parkwood Ave
- 294 Maple Place
- 240 Maple Ave
- 315 Maple Ave
- 235 Maple Ave
Your Personal Tour Guide
Ask me questions while you tour the home.