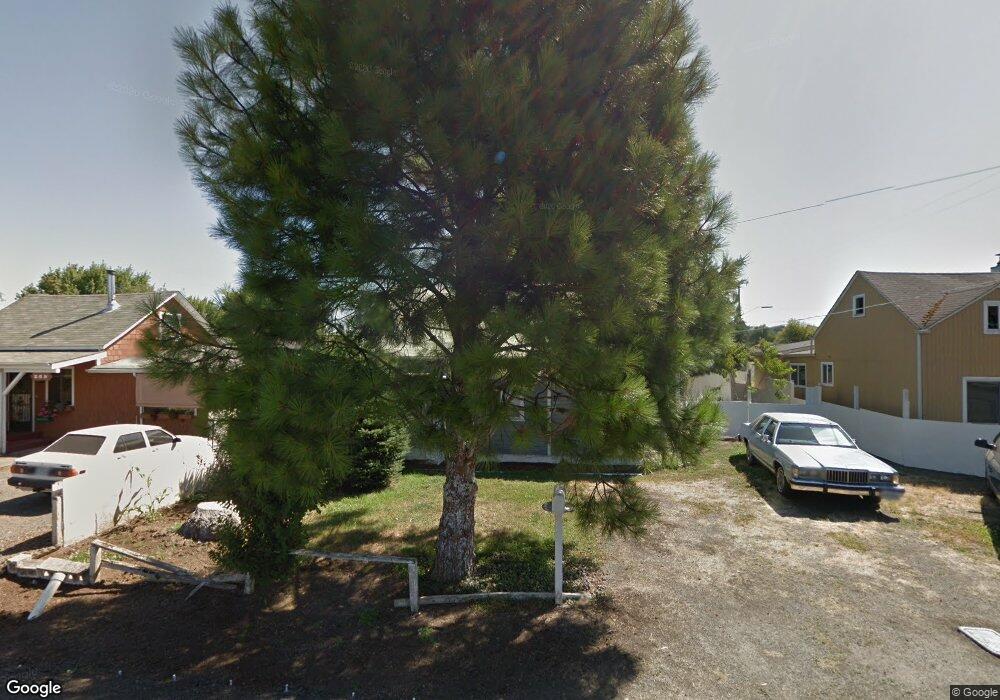
275 N 38th Place Springfield, OR 97478
East Springfield NeighborhoodEstimated Value: $304,000 - $358,568
3
Beds
1
Bath
1,050
Sq Ft
$318/Sq Ft
Est. Value
About This Home
This home is located at 275 N 38th Place, Springfield, OR 97478 and is currently estimated at $333,392, approximately $317 per square foot. 275 N 38th Place is a home located in Lane County with nearby schools including Riverbend Elementary School, Briggs Middle School, and Thurston High School.
Ownership History
Date
Name
Owned For
Owner Type
Purchase Details
Closed on
May 21, 2015
Sold by
Hillyard Alan L and Hillyard Janice L
Bought by
Wallace Dwight and Wallace Nicole
Current Estimated Value
Home Financials for this Owner
Home Financials are based on the most recent Mortgage that was taken out on this home.
Original Mortgage
$157,102
Outstanding Balance
$121,854
Interest Rate
3.87%
Mortgage Type
FHA
Estimated Equity
$211,538
Purchase Details
Closed on
Apr 28, 2003
Sold by
Howard Barbara
Bought by
Hillyard Alan L and Hillyard Janice L
Home Financials for this Owner
Home Financials are based on the most recent Mortgage that was taken out on this home.
Original Mortgage
$70,000
Interest Rate
5.72%
Create a Home Valuation Report for This Property
The Home Valuation Report is an in-depth analysis detailing your home's value as well as a comparison with similar homes in the area
Home Values in the Area
Average Home Value in this Area
Purchase History
| Date | Buyer | Sale Price | Title Company |
|---|---|---|---|
| Wallace Dwight | $162,400 | Cascade Title Company | |
| Hillyard Alan L | $114,000 | Fidelity Natl Title Ins Co O |
Source: Public Records
Mortgage History
| Date | Status | Borrower | Loan Amount |
|---|---|---|---|
| Open | Wallace Dwight | $157,102 | |
| Previous Owner | Hillyard Alan L | $70,000 |
Source: Public Records
Tax History Compared to Growth
Tax History
| Year | Tax Paid | Tax Assessment Tax Assessment Total Assessment is a certain percentage of the fair market value that is determined by local assessors to be the total taxable value of land and additions on the property. | Land | Improvement |
|---|---|---|---|---|
| 2024 | $2,741 | $147,518 | -- | -- |
| 2023 | $2,741 | $143,222 | $0 | $0 |
| 2022 | $2,539 | $139,051 | $0 | $0 |
| 2021 | $2,493 | $135,001 | $0 | $0 |
| 2020 | $2,420 | $131,069 | $0 | $0 |
| 2019 | $2,348 | $127,252 | $0 | $0 |
| 2018 | $2,213 | $119,948 | $0 | $0 |
| 2017 | $2,128 | $119,948 | $0 | $0 |
| 2016 | $2,083 | $116,454 | $0 | $0 |
| 2015 | $2,024 | $113,062 | $0 | $0 |
| 2014 | $1,993 | $109,769 | $0 | $0 |
Source: Public Records
Map
Nearby Homes