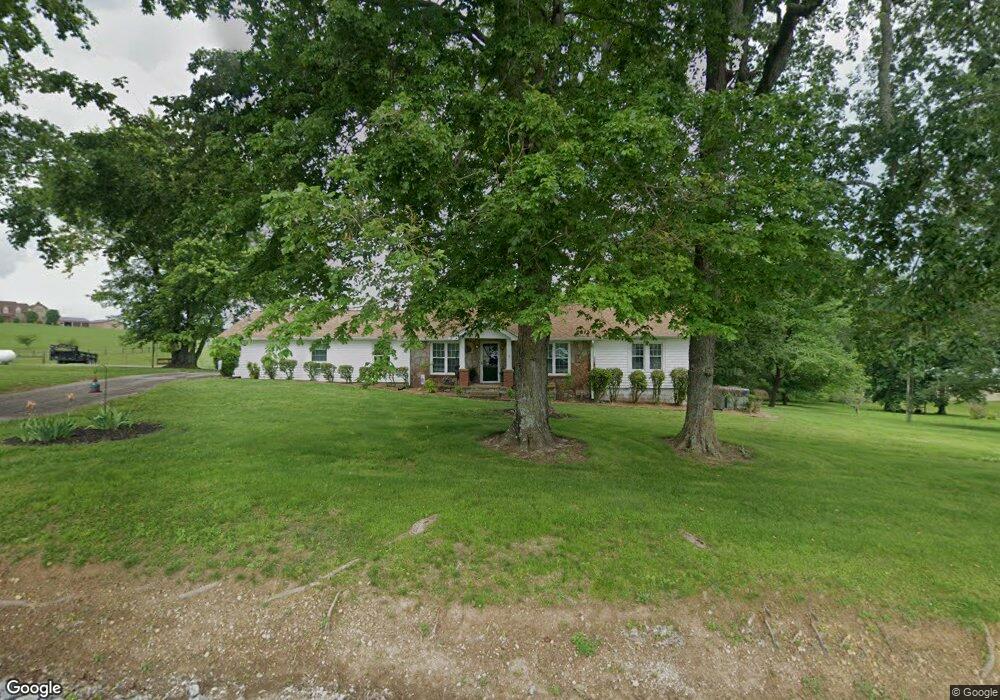
275 Naron Rd Shelbyville, TN 37160
Estimated Value: $366,743 - $531,000
--
Bed
2
Baths
2,122
Sq Ft
$213/Sq Ft
Est. Value
About This Home
This home is located at 275 Naron Rd, Shelbyville, TN 37160 and is currently estimated at $452,436, approximately $213 per square foot. 275 Naron Rd is a home located in Bedford County with nearby schools including Liberty Elementary School.
Ownership History
Date
Name
Owned For
Owner Type
Purchase Details
Closed on
Apr 25, 2000
Bought by
Sanders Barbara E Et Vir James Roger
Current Estimated Value
Purchase Details
Closed on
Nov 3, 1999
Sold by
Grissom Michael D
Bought by
Oliver Russell W and Oliver Martha
Purchase Details
Closed on
Jul 12, 1991
Bought by
Grissom Michael D and Grissom Angela H
Purchase Details
Closed on
Mar 25, 1990
Bought by
Hix Henry Holt
Purchase Details
Closed on
Jul 16, 1979
Bought by
Naron Virgil and Naron Angeline
Purchase Details
Closed on
Sep 20, 1938
Purchase Details
Closed on
Jun 1, 1936
Create a Home Valuation Report for This Property
The Home Valuation Report is an in-depth analysis detailing your home's value as well as a comparison with similar homes in the area
Home Values in the Area
Average Home Value in this Area
Purchase History
| Date | Buyer | Sale Price | Title Company |
|---|---|---|---|
| Sanders Barbara E Et Vir James Roger | $155,000 | -- | |
| Oliver Russell W | -- | -- | |
| Grissom Michael D | $25,000 | -- | |
| Hix Henry Holt | $20,000 | -- | |
| Naron Virgil | -- | -- | |
| -- | -- | -- | |
| -- | -- | -- |
Source: Public Records
Tax History Compared to Growth
Tax History
| Year | Tax Paid | Tax Assessment Tax Assessment Total Assessment is a certain percentage of the fair market value that is determined by local assessors to be the total taxable value of land and additions on the property. | Land | Improvement |
|---|---|---|---|---|
| 2025 | $1,453 | $62,500 | $0 | $0 |
| 2024 | $1,453 | $62,500 | $18,375 | $44,125 |
| 2023 | $1,453 | $62,500 | $18,375 | $44,125 |
| 2022 | $1,453 | $62,500 | $18,375 | $44,125 |
| 2021 | $1,228 | $62,500 | $18,375 | $44,125 |
| 2020 | $1,076 | $62,500 | $18,375 | $44,125 |
| 2019 | $1,076 | $40,450 | $12,725 | $27,725 |
| 2018 | $1,036 | $40,450 | $12,725 | $27,725 |
| 2017 | $1,036 | $40,450 | $12,725 | $27,725 |
| 2016 | $1,019 | $40,450 | $12,725 | $27,725 |
| 2015 | $1,019 | $40,450 | $12,725 | $27,725 |
| 2014 | $910 | $40,093 | $0 | $0 |
Source: Public Records
Map
Nearby Homes