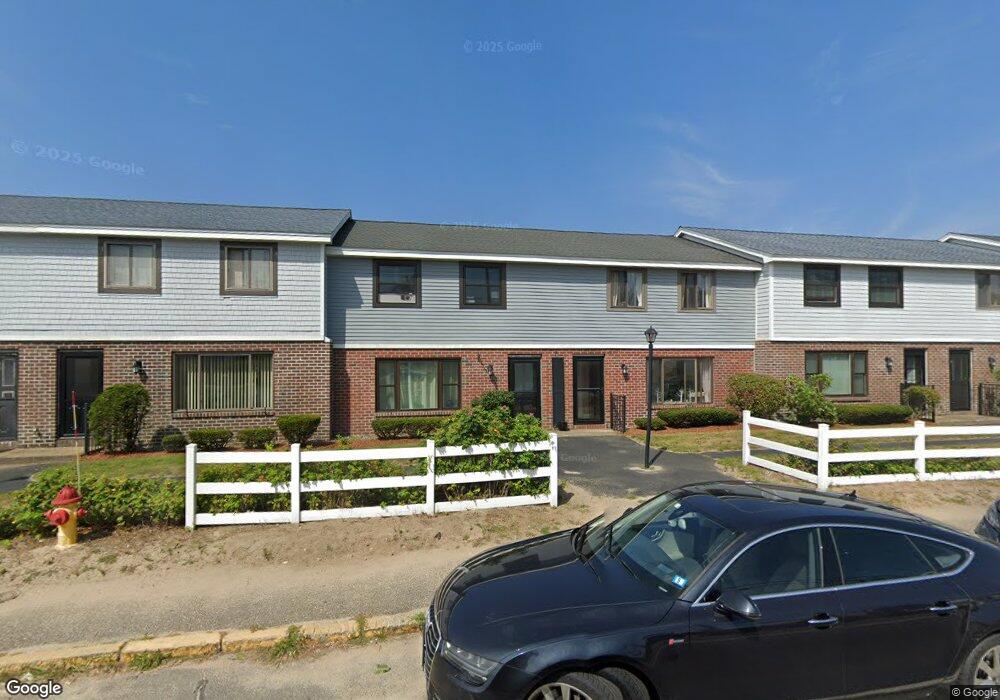
275 North End Blvd Unit C8 Salisbury, MA 01952
Estimated Value: $445,065 - $544,000
2
Beds
2
Baths
1,230
Sq Ft
$401/Sq Ft
Est. Value
About This Home
This home is located at 275 North End Blvd Unit C8, Salisbury, MA 01952 and is currently estimated at $493,016, approximately $400 per square foot. 275 North End Blvd Unit C8 is a home located in Essex County with nearby schools including Triton Regional High School.
Ownership History
Date
Name
Owned For
Owner Type
Purchase Details
Closed on
Sep 15, 2021
Sold by
Halloran John E and Halloran Patricia D
Bought by
J & Patricia Halloran Irt
Current Estimated Value
Purchase Details
Closed on
Aug 29, 2017
Sold by
Halloran John E and Halloran Patricia D
Bought by
Halloran Ft
Purchase Details
Closed on
Mar 1, 2017
Sold by
Doane Jase and Doane Melissa
Bought by
Halloran John E and Halloran Patricia D
Home Financials for this Owner
Home Financials are based on the most recent Mortgage that was taken out on this home.
Original Mortgage
$165,500
Interest Rate
4.09%
Mortgage Type
New Conventional
Purchase Details
Closed on
Sep 7, 2007
Sold by
Quartarone Annette M and Quartarone Joseph L
Bought by
Doane Jase
Home Financials for this Owner
Home Financials are based on the most recent Mortgage that was taken out on this home.
Original Mortgage
$213,750
Interest Rate
6.74%
Mortgage Type
Purchase Money Mortgage
Create a Home Valuation Report for This Property
The Home Valuation Report is an in-depth analysis detailing your home's value as well as a comparison with similar homes in the area
Home Values in the Area
Average Home Value in this Area
Purchase History
| Date | Buyer | Sale Price | Title Company |
|---|---|---|---|
| J & Patricia Halloran Irt | -- | None Available | |
| Halloran John E | -- | None Available | |
| Halloran Ft | -- | -- | |
| Halloran John E | $225,500 | -- | |
| Doane Jase | $225,000 | -- |
Source: Public Records
Mortgage History
| Date | Status | Borrower | Loan Amount |
|---|---|---|---|
| Previous Owner | Halloran John E | $165,500 | |
| Previous Owner | Doane Jase | $207,700 | |
| Previous Owner | Doane Jase | $213,750 |
Source: Public Records
Tax History Compared to Growth
Tax History
| Year | Tax Paid | Tax Assessment Tax Assessment Total Assessment is a certain percentage of the fair market value that is determined by local assessors to be the total taxable value of land and additions on the property. | Land | Improvement |
|---|---|---|---|---|
| 2025 | $3,325 | $329,900 | $0 | $329,900 |
| 2024 | $2,958 | $283,100 | $0 | $283,100 |
| 2023 | $2,865 | $265,300 | $0 | $265,300 |
| 2022 | $2,889 | $259,300 | $0 | $259,300 |
| 2021 | $2,829 | $251,200 | $0 | $251,200 |
| 2020 | $2,879 | $251,200 | $0 | $251,200 |
| 2019 | $2,974 | $250,800 | $0 | $250,800 |
| 2018 | $2,788 | $227,300 | $0 | $227,300 |
| 2017 | $2,739 | $229,800 | $0 | $229,800 |
| 2016 | $2,509 | $215,000 | $0 | $215,000 |
| 2015 | $2,785 | $237,000 | $0 | $237,000 |
Source: Public Records
Map
Nearby Homes
- 10 Liberty St
- 188 N End Blvd Unit 3
- 178 N End Blvd Unit A
- 178 N End Blvd Unit C
- 178 N End Blvd Unit F
- 168 N End Blvd
- 98 Central Ave
- 432 N End Blvd
- 38-40 Central Ave
- 16 N End Blvd Unit 10
- 16 N End Blvd Unit 8
- 16 N End Blvd Unit 3
- 16 N End Blvd Unit 12
- 16 N End Blvd Unit 5
- 479 N End Blvd
- 492 N End Blvd
- 498 N End Blvd
- 45 Old County Rd Unit 1
- 522 N End Blvd
- 20 Cable Ave Unit 11
- 275 North End Blvd Unit D2
- 275 North End Blvd Unit D1
- 275 North End Blvd Unit C9
- 275 North End Blvd Unit C7
- 275 North End Blvd Unit C6
- 275 North End Blvd Unit C5
- 275 North End Blvd Unit C4
- 275 North End Blvd Unit C3
- 275 North End Blvd Unit C2
- 275 North End Blvd Unit C12
- 275 North End Blvd Unit C11
- 275 North End Blvd Unit C10
- 275 North End Blvd Unit C1
- 275 North End Blvd Unit B9
- 275 North End Blvd Unit B8
- 275 North End Blvd Unit B7
- 275 North End Blvd Unit B6
- 275 North End Blvd Unit B5
- 275 North End Blvd Unit B4
- 275 North End Blvd Unit B3