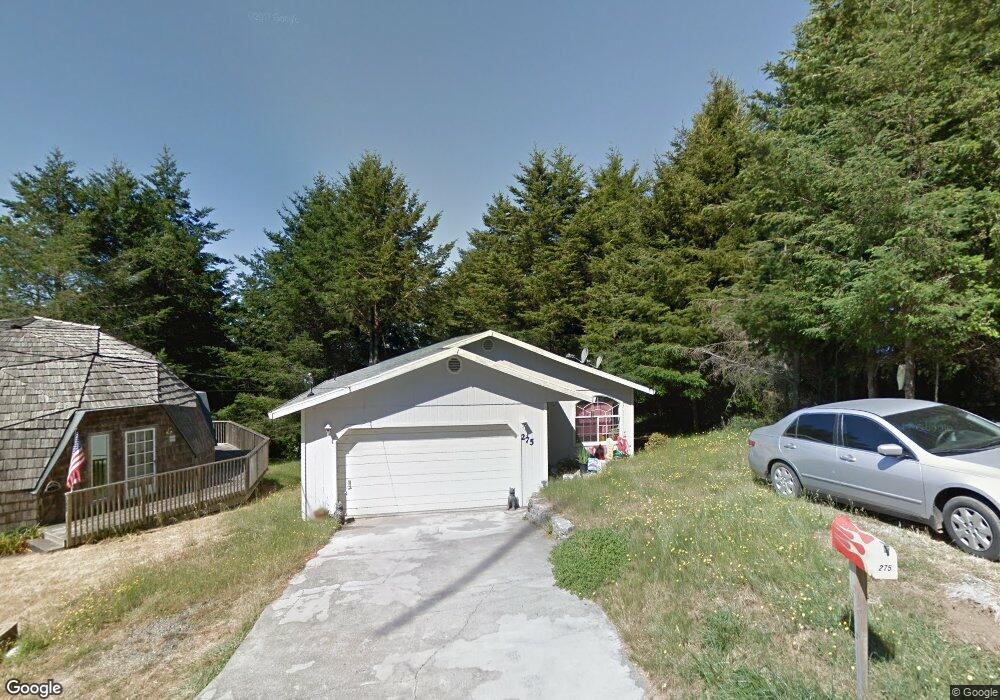
275 Seafoam Rd Whitethorn, CA 95589
Shelter Cove NeighborhoodEstimated Value: $296,000 - $446,000
--
Bed
--
Bath
--
Sq Ft
6,011
Sq Ft Lot
About This Home
This home is located at 275 Seafoam Rd, Whitethorn, CA 95589 and is currently estimated at $378,774. 275 Seafoam Rd is a home located in Humboldt County.
Ownership History
Date
Name
Owned For
Owner Type
Purchase Details
Closed on
Feb 11, 2003
Sold by
Surber James V
Bought by
Surber James V and Surber Caryn R
Current Estimated Value
Home Financials for this Owner
Home Financials are based on the most recent Mortgage that was taken out on this home.
Original Mortgage
$169,200
Outstanding Balance
$87,126
Interest Rate
8.79%
Estimated Equity
$291,648
Purchase Details
Closed on
Apr 27, 2000
Sold by
Surber Caryn
Bought by
Surber James V
Home Financials for this Owner
Home Financials are based on the most recent Mortgage that was taken out on this home.
Original Mortgage
$111,300
Interest Rate
10.49%
Create a Home Valuation Report for This Property
The Home Valuation Report is an in-depth analysis detailing your home's value as well as a comparison with similar homes in the area
Home Values in the Area
Average Home Value in this Area
Purchase History
| Date | Buyer | Sale Price | Title Company |
|---|---|---|---|
| Surber James V | -- | First American Title Ins Co | |
| Surber James V | -- | Humboldt Land Title Company | |
| Surber James V | $139,500 | Humboldt Land Title Company |
Source: Public Records
Mortgage History
| Date | Status | Borrower | Loan Amount |
|---|---|---|---|
| Open | Surber James V | $169,200 | |
| Closed | Surber James V | $111,300 | |
| Closed | Surber James V | $20,868 |
Source: Public Records
Tax History Compared to Growth
Tax History
| Year | Tax Paid | Tax Assessment Tax Assessment Total Assessment is a certain percentage of the fair market value that is determined by local assessors to be the total taxable value of land and additions on the property. | Land | Improvement |
|---|---|---|---|---|
| 2025 | $2,498 | $213,804 | $46,095 | $167,709 |
| 2024 | $2,498 | $209,613 | $45,192 | $164,421 |
| 2023 | $2,506 | $205,504 | $44,306 | $161,198 |
| 2022 | $2,469 | $201,476 | $43,438 | $158,038 |
| 2021 | $2,384 | $197,527 | $42,587 | $154,940 |
| 2020 | $2,396 | $195,503 | $42,151 | $153,352 |
| 2019 | $2,341 | $191,671 | $41,325 | $150,346 |
| 2018 | $2,304 | $187,914 | $40,515 | $147,399 |
| 2017 | $2,164 | $184,230 | $39,721 | $144,509 |
| 2016 | $2,150 | $180,619 | $38,943 | $141,676 |
| 2015 | $2,139 | $177,907 | $38,359 | $139,548 |
| 2014 | $2,079 | $174,423 | $37,608 | $136,815 |
Source: Public Records
Map
Nearby Homes