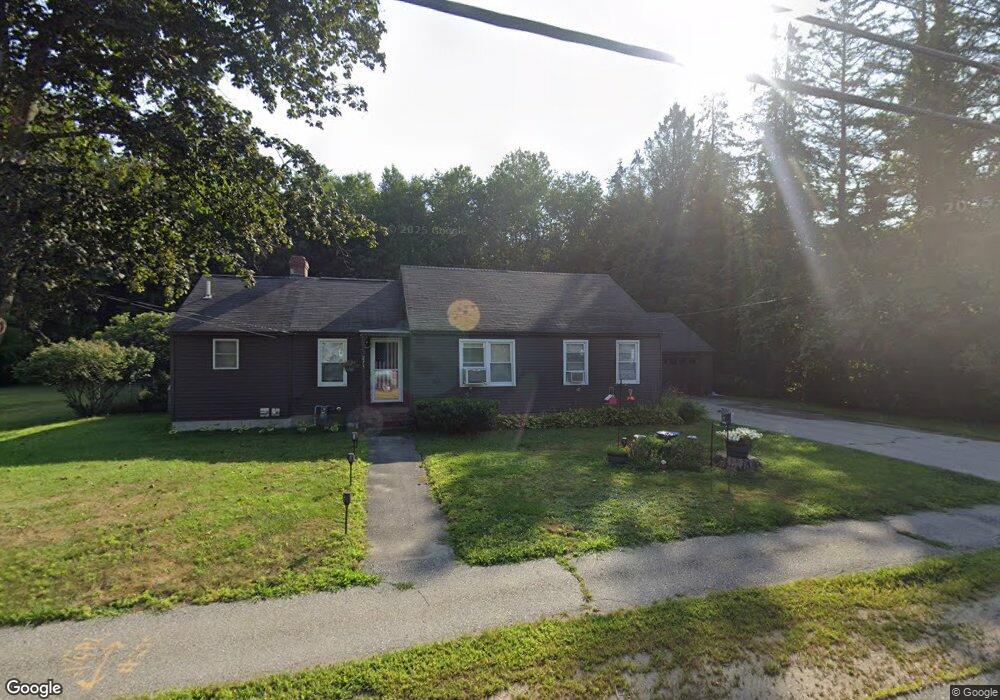
275 South St Concord, NH 03301
South End NeighborhoodEstimated Value: $493,503 - $564,000
4
Beds
3
Baths
1,669
Sq Ft
$313/Sq Ft
Est. Value
About This Home
This home is located at 275 South St, Concord, NH 03301 and is currently estimated at $521,876, approximately $312 per square foot. 275 South St is a home located in Merrimack County with nearby schools including Abbot-Downing School, Rundlett Middle School, and Concord High School.
Ownership History
Date
Name
Owned For
Owner Type
Purchase Details
Closed on
Mar 27, 2008
Sold by
Nolin Gerard J Est
Bought by
Nyhan Keith E and Nyhan Sarah E
Current Estimated Value
Home Financials for this Owner
Home Financials are based on the most recent Mortgage that was taken out on this home.
Original Mortgage
$238,546
Outstanding Balance
$149,446
Interest Rate
5.76%
Mortgage Type
Purchase Money Mortgage
Estimated Equity
$372,430
Create a Home Valuation Report for This Property
The Home Valuation Report is an in-depth analysis detailing your home's value as well as a comparison with similar homes in the area
Home Values in the Area
Average Home Value in this Area
Purchase History
| Date | Buyer | Sale Price | Title Company |
|---|---|---|---|
| Nyhan Keith E | $244,500 | -- |
Source: Public Records
Mortgage History
| Date | Status | Borrower | Loan Amount |
|---|---|---|---|
| Open | Nyhan Keith E | $8,022 | |
| Open | Nyhan Keith E | $238,546 |
Source: Public Records
Tax History Compared to Growth
Tax History
| Year | Tax Paid | Tax Assessment Tax Assessment Total Assessment is a certain percentage of the fair market value that is determined by local assessors to be the total taxable value of land and additions on the property. | Land | Improvement |
|---|---|---|---|---|
| 2024 | $8,606 | $310,800 | $111,400 | $199,400 |
| 2023 | $8,348 | $310,800 | $111,400 | $199,400 |
| 2022 | $8,047 | $310,800 | $111,400 | $199,400 |
| 2021 | $7,853 | $312,600 | $111,400 | $201,200 |
| 2020 | $7,469 | $279,100 | $89,000 | $190,100 |
| 2019 | $6,806 | $245,000 | $87,300 | $157,700 |
| 2018 | $6,559 | $243,300 | $87,300 | $156,000 |
| 2017 | $6,718 | $237,900 | $87,300 | $150,600 |
| 2016 | $6,028 | $228,700 | $85,600 | $143,100 |
| 2015 | $5,794 | $220,200 | $89,300 | $130,900 |
| 2014 | $5,604 | $220,200 | $89,300 | $130,900 |
| 2013 | -- | $217,800 | $89,300 | $128,500 |
| 2012 | -- | $212,800 | $89,300 | $123,500 |
Source: Public Records
Map
Nearby Homes