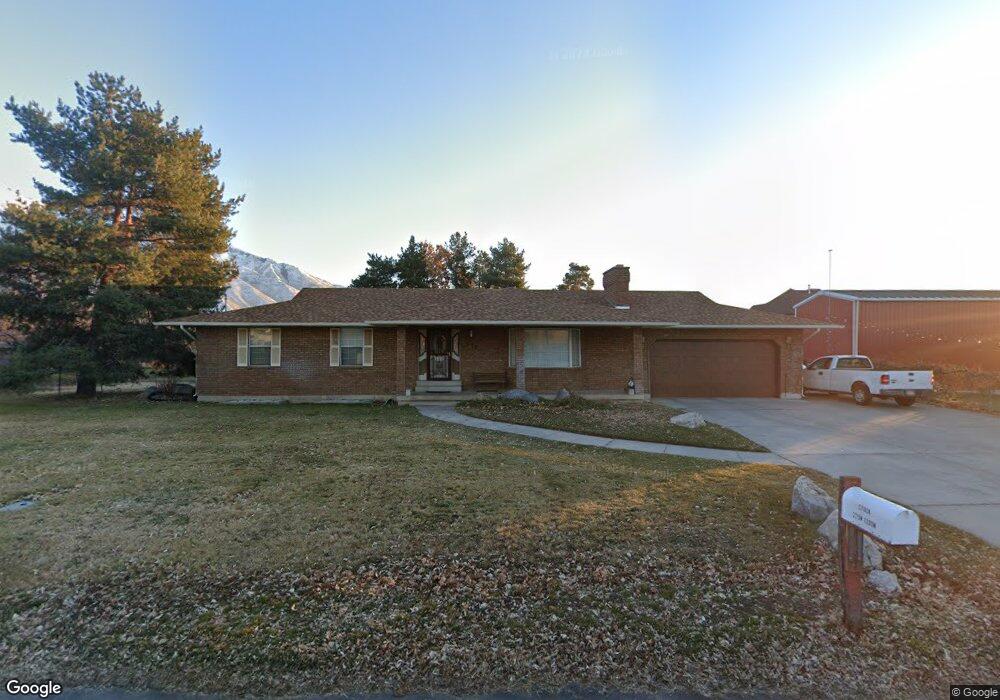
275 W 1200 N Mapleton, UT 84664
5
Beds
2
Baths
1,831
Sq Ft
17,424
Sq Ft Lot
About This Home
This home is located at 275 W 1200 N, Mapleton, UT 84664. 275 W 1200 N is a home located in Utah County with nearby schools including Mapleton School, Mapleton Junior High School, and Maple Mountain High School.
Create a Home Valuation Report for This Property
The Home Valuation Report is an in-depth analysis detailing your home's value as well as a comparison with similar homes in the area
Home Values in the Area
Average Home Value in this Area
Tax History
| Year | Tax Paid | Tax Assessment Tax Assessment Total Assessment is a certain percentage of the fair market value that is determined by local assessors to be the total taxable value of land and additions on the property. | Land | Improvement |
|---|---|---|---|---|
| 2024 | $3,280 | $321,310 | $0 | $0 |
| 2023 | $3,405 | $335,665 | $0 | $0 |
| 2022 | $3,818 | $372,185 | $0 | $0 |
| 2021 | $3,216 | $481,300 | $170,000 | $311,300 |
| 2020 | $3,189 | $461,700 | $150,400 | $311,300 |
| 2019 | $2,955 | $436,600 | $144,300 | $292,300 |
| 2018 | $2,601 | $365,800 | $121,500 | $244,300 |
| 2017 | $2,431 | $181,500 | $0 | $0 |
| 2016 | $2,277 | $168,960 | $0 | $0 |
| 2015 | $2,206 | $162,690 | $0 | $0 |
| 2014 | $2,078 | $150,480 | $0 | $0 |
Source: Public Records
Map
Nearby Homes
- 897 N Main St
- 1350 N Main St
- 667 N 550 W
- 145 W Carnesecca Ct
- 435 E 1000 N
- 405 W 1200 N Unit 4
- 487 W 1200 N Unit 1
- 84 E 530 N
- 265 E 600 N
- 754 W 400 N Unit 29
- 1884 Town And Country Rd
- 1567 N 600 E Unit 26
- 1195 W 1600 N
- 775 N 800 E
- 1121 W 1800 N
- 715 E 1700 N
- 1225 N 1380 W
- 1410 W 1200 N
- 1096 N 1000 E
- 1839 River Bottom Rd
Your Personal Tour Guide
Ask me questions while you tour the home.