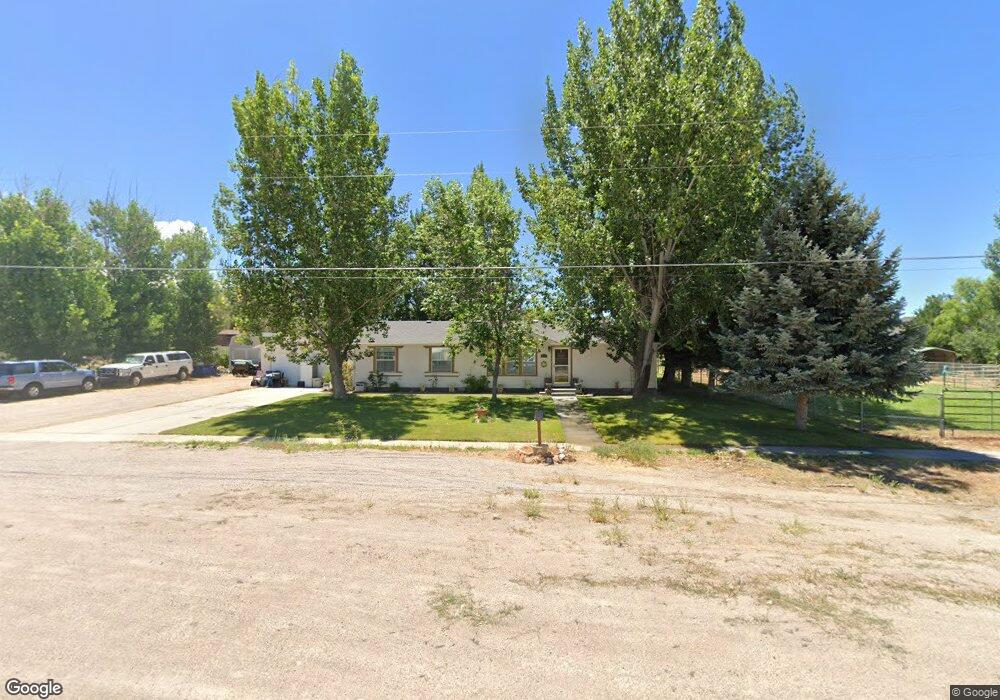
275 W 400 N Fillmore, UT 84631
Estimated Value: $314,000 - $366,000
3
Beds
2
Baths
1,562
Sq Ft
$219/Sq Ft
Est. Value
About This Home
This home is located at 275 W 400 N, Fillmore, UT 84631 and is currently estimated at $342,499, approximately $219 per square foot. 275 W 400 N is a home located in Millard County.
Ownership History
Date
Name
Owned For
Owner Type
Purchase Details
Closed on
Mar 11, 2014
Sold by
Carl Thomas Carl Thomas and Demolen Revocable Trust Dtd Ma Thomas L And J
Bought by
Olsen Teri Louise
Current Estimated Value
Home Financials for this Owner
Home Financials are based on the most recent Mortgage that was taken out on this home.
Original Mortgage
$135,009
Outstanding Balance
$100,177
Interest Rate
3.95%
Mortgage Type
FHA
Estimated Equity
$242,322
Purchase Details
Closed on
Jan 8, 2013
Bought by
Demolen Carl Thomas and The Thomas L Demolen And Josef
Purchase Details
Closed on
Jan 21, 2005
Sold by
Tingey Conway P and Tingey Berdine S
Bought by
Tingey Conway P and Tinget Berdine S
Purchase Details
Closed on
Jan 18, 2005
Sold by
Burnett Charles W
Bought by
Tingey Conway P and Tingey Berdine S
Create a Home Valuation Report for This Property
The Home Valuation Report is an in-depth analysis detailing your home's value as well as a comparison with similar homes in the area
Home Values in the Area
Average Home Value in this Area
Purchase History
| Date | Buyer | Sale Price | Title Company |
|---|---|---|---|
| Olsen Teri Louise | -- | First American Title | |
| Demolen Carl Thomas | -- | -- | |
| Tingey Conway P | -- | First American Title Insuran | |
| Tingey Conway P | -- | First American Title Insuran |
Source: Public Records
Mortgage History
| Date | Status | Borrower | Loan Amount |
|---|---|---|---|
| Open | Olsen Teri Louise | $135,009 |
Source: Public Records
Tax History
| Year | Tax Paid | Tax Assessment Tax Assessment Total Assessment is a certain percentage of the fair market value that is determined by local assessors to be the total taxable value of land and additions on the property. | Land | Improvement |
|---|---|---|---|---|
| 2025 | $1,489 | $187,069 | $46,860 | $140,209 |
| 2024 | $1,489 | $159,234 | $37,177 | $122,057 |
| 2023 | $1,712 | $159,234 | $37,177 | $122,057 |
| 2022 | $1,390 | $124,845 | $34,075 | $90,770 |
| 2021 | $1,185 | $102,148 | $22,127 | $80,021 |
| 2020 | $1,093 | $94,762 | $20,115 | $74,647 |
| 2019 | $1,089 | $94,762 | $20,115 | $74,647 |
| 2018 | $897 | $79,832 | $20,115 | $59,717 |
| 2017 | $831 | $70,362 | $20,115 | $50,247 |
| 2016 | $795 | $70,362 | $20,115 | $50,247 |
| 2015 | $795 | $70,362 | $20,115 | $50,247 |
| 2014 | -- | $64,656 | $20,115 | $44,541 |
| 2013 | -- | $61,387 | $20,115 | $41,272 |
Source: Public Records
Map
Nearby Homes
- 335 W 400 North St
- 245 W 300 N
- 390 N 100 W
- 225 W 200 St N
- 75 N 100 West St
- 410 W 400 N
- 155 W Center St
- 351 W 100 South St
- 40 S 100 Rd E
- 260 W 200 S
- 250 S Main St
- 310 S 500 West Rd
- 220 S 200 E
- 2155 N Cedar Mountain Rd
- 2835 N Cedar Mountain Rd
- 465 S 100 W
- 155 E 500 St S
- 157 E 500 South St
- 405 E 500 St S
- 690 E 500 S
Your Personal Tour Guide
Ask me questions while you tour the home.