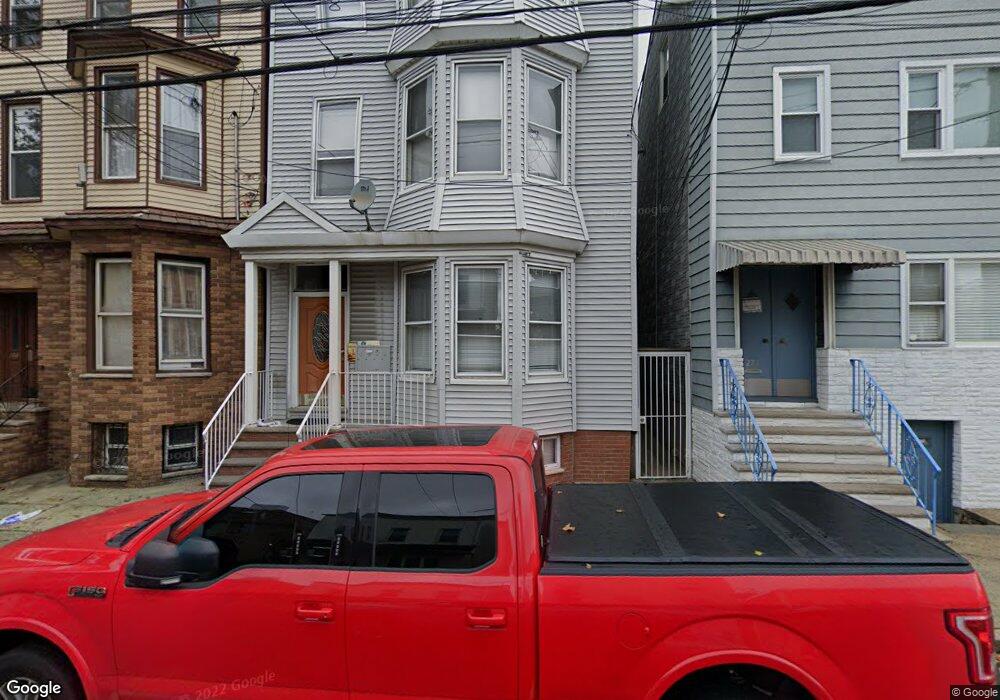
275 Walnut St Newark, NJ 07105
South Ironbound NeighborhoodEstimated Value: $777,608 - $1,042,000
Studio
--
Bath
6,508
Sq Ft
$149/Sq Ft
Est. Value
About This Home
This home is located at 275 Walnut St, Newark, NJ 07105 and is currently estimated at $969,902, approximately $149 per square foot. 275 Walnut St is a home located in Essex County with nearby schools including Lafayette Street Elementary School, Oliver Street School, and Hawkins Street Elementary School.
Ownership History
Date
Name
Owned For
Owner Type
Purchase Details
Closed on
Sep 30, 2009
Sold by
Bonge Nicholas D
Bought by
Silva Abel and Silva Fernanda
Current Estimated Value
Purchase Details
Closed on
Apr 7, 2008
Sold by
Malangone Josephine and Bonge Josephine
Bought by
Malangone Josephine
Purchase Details
Closed on
Oct 24, 1992
Sold by
Catalano Amelia and Catalano Malangone,J
Bought by
Catalano Amelia and Catalano Malangone,J
Create a Home Valuation Report for This Property
The Home Valuation Report is an in-depth analysis detailing your home's value as well as a comparison with similar homes in the area
Home Values in the Area
Average Home Value in this Area
Purchase History
| Date | Buyer | Sale Price | Title Company |
|---|---|---|---|
| Silva Abel | $285,000 | Multiple | |
| Malangone Josephine | -- | None Available | |
| Catalano Amelia | -- | -- |
Source: Public Records
Tax History
| Year | Tax Paid | Tax Assessment Tax Assessment Total Assessment is a certain percentage of the fair market value that is determined by local assessors to be the total taxable value of land and additions on the property. | Land | Improvement |
|---|---|---|---|---|
| 2025 | $11,419 | $306,300 | $73,500 | $232,800 |
| 2024 | $11,419 | $306,300 | $73,500 | $232,800 |
| 2022 | $11,443 | $306,300 | $73,500 | $232,800 |
| 2021 | $11,437 | $306,300 | $73,500 | $232,800 |
| 2020 | $11,639 | $306,300 | $73,500 | $232,800 |
| 2019 | $11,520 | $306,300 | $73,500 | $232,800 |
| 2018 | $11,312 | $306,300 | $73,500 | $232,800 |
| 2017 | $10,904 | $306,300 | $73,500 | $232,800 |
| 2016 | $10,537 | $306,300 | $73,500 | $232,800 |
| 2015 | $10,135 | $306,300 | $73,500 | $232,800 |
| 2014 | $9,498 | $306,300 | $73,500 | $232,800 |
Source: Public Records
Map
Nearby Homes
- 267 Walnut St
- 176 Jefferson St
- 250-252 Elm St
- 250 Elm St Unit 252
- 198 Jefferson St
- 63 Warwick St
- 233-235 Adams St
- 23 Nichols St
- 332 Lafayette St
- 234 Jefferson St
- 297 E Kinney St
- 44 Pacific St Unit 46
- 195 Walnut St
- 255 E Kinney St
- 228 E Kinney St
- 149 Union St
- 279 New York Ave
- 76 Union St
- 76 Union St Unit A10
- 79 1/2 Merchant St
Your Personal Tour Guide
Ask me questions while you tour the home.