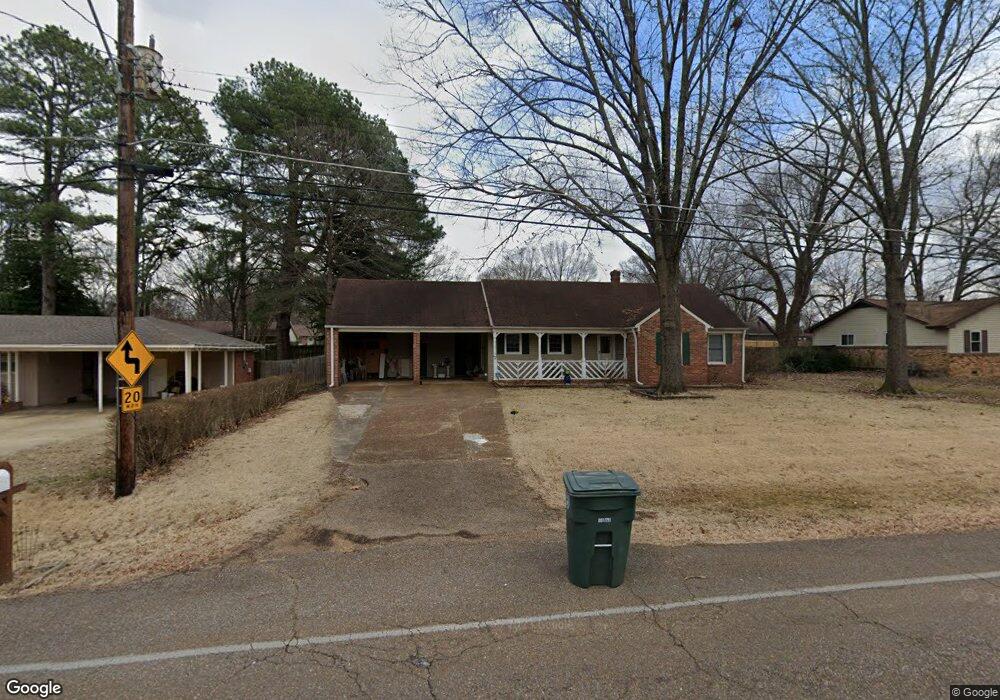
2750 Elmore Park Rd Memphis, TN 38134
Estimated Value: $230,000 - $257,724
3
Beds
2
Baths
1,421
Sq Ft
$171/Sq Ft
Est. Value
About This Home
This home is located at 2750 Elmore Park Rd, Memphis, TN 38134 and is currently estimated at $243,181, approximately $171 per square foot. 2750 Elmore Park Rd is a home located in Shelby County with nearby schools including Altruria Elementary School, Elmore Park Middle School, and Bartlett High School.
Ownership History
Date
Name
Owned For
Owner Type
Purchase Details
Closed on
Jan 3, 2006
Sold by
Hsbc Bank Usa
Bought by
Floyd Precely R and Floyd Sherry
Current Estimated Value
Home Financials for this Owner
Home Financials are based on the most recent Mortgage that was taken out on this home.
Original Mortgage
$103,600
Outstanding Balance
$57,782
Interest Rate
6.14%
Mortgage Type
Fannie Mae Freddie Mac
Estimated Equity
$185,399
Purchase Details
Closed on
Jul 20, 2005
Sold by
Campbell Milisa
Bought by
Hsbc Bank Usa and The Ace Securities Corp Home Equity Loan
Purchase Details
Closed on
Jul 30, 2003
Sold by
Walters Curtis and Walters Kay
Bought by
Campbell Milisa
Home Financials for this Owner
Home Financials are based on the most recent Mortgage that was taken out on this home.
Original Mortgage
$140,000
Interest Rate
8.25%
Mortgage Type
Unknown
Create a Home Valuation Report for This Property
The Home Valuation Report is an in-depth analysis detailing your home's value as well as a comparison with similar homes in the area
Home Values in the Area
Average Home Value in this Area
Purchase History
| Date | Buyer | Sale Price | Title Company |
|---|---|---|---|
| Floyd Precely R | $129,500 | None Available | |
| Hsbc Bank Usa | $114,750 | -- | |
| Campbell Milisa | $140,000 | Equity Title & Escrow Co |
Source: Public Records
Mortgage History
| Date | Status | Borrower | Loan Amount |
|---|---|---|---|
| Open | Floyd Precely R | $103,600 | |
| Previous Owner | Campbell Milisa | $140,000 |
Source: Public Records
Tax History Compared to Growth
Tax History
| Year | Tax Paid | Tax Assessment Tax Assessment Total Assessment is a certain percentage of the fair market value that is determined by local assessors to be the total taxable value of land and additions on the property. | Land | Improvement |
|---|---|---|---|---|
| 2025 | $2,157 | $58,325 | $12,250 | $46,075 |
| 2024 | $2,157 | $42,125 | $7,475 | $34,650 |
| 2023 | $2,157 | $42,125 | $7,475 | $34,650 |
| 2022 | $2,157 | $42,125 | $7,475 | $34,650 |
| 2021 | $2,191 | $42,125 | $7,475 | $34,650 |
| 2020 | $1,768 | $30,075 | $6,550 | $23,525 |
| 2019 | $1,768 | $30,075 | $6,550 | $23,525 |
| 2018 | $1,768 | $30,075 | $6,550 | $23,525 |
| 2017 | $1,236 | $30,075 | $6,550 | $23,525 |
| 2016 | $1,386 | $31,725 | $0 | $0 |
| 2014 | $1,386 | $31,725 | $0 | $0 |
Source: Public Records
Map
Nearby Homes
- 6224 Venus Ave
- 2784 Bragg Ln
- 2723 Mercury St
- 6085 Ivanhoe Rd
- 2798 Stage Center Dr
- 0 Stage Center Cove
- 6016 Ivawood Dr
- 0 Bartlett Blvd Unit 10203764
- 0 Bartlett Blvd Unit 10203763
- 3024 Ingleside Dr
- 3038 Elmore Park Rd
- 2623 Surrey Wood Dr
- 3047 Newmarket Dr
- 5981 Diplomat Place
- 3107 Mary Elizabeth Dr
- 6264 Northampton Dr
- 2426 Lacosta Dr
- 1970 Court St
- 2935 Court St
- 6267 Barwick Dr
- 2760 Elmore Park Rd
- 2740 Elmore Park Rd
- 2753 Satellite St
- 2745 Satellite St
- 2763 Satellite St
- 2737 Satellite St
- 2770 Elmore Park Rd
- 2751 Elmore Park Rd
- 2730 Elmore Park Rd
- 2761 Elmore Park Rd
- 2771 Satellite St
- 2727 Satellite St
- 2771 Elmore Park Rd
- 2780 Elmore Park Rd
- 2752 Satellite St
- 2744 Satellite St
- 2718 Elmore Park Rd
- 2779 Satellite St
- 2762 Satellite St
- 2750 Bragg Ln