
Landlord's Agent in 2019
JoAnne Schorsten
KW Classic Properties Realty
(614) 792-1199
7 in this area
53 Total Sales

Estimated Value: $650,000 - $866,000
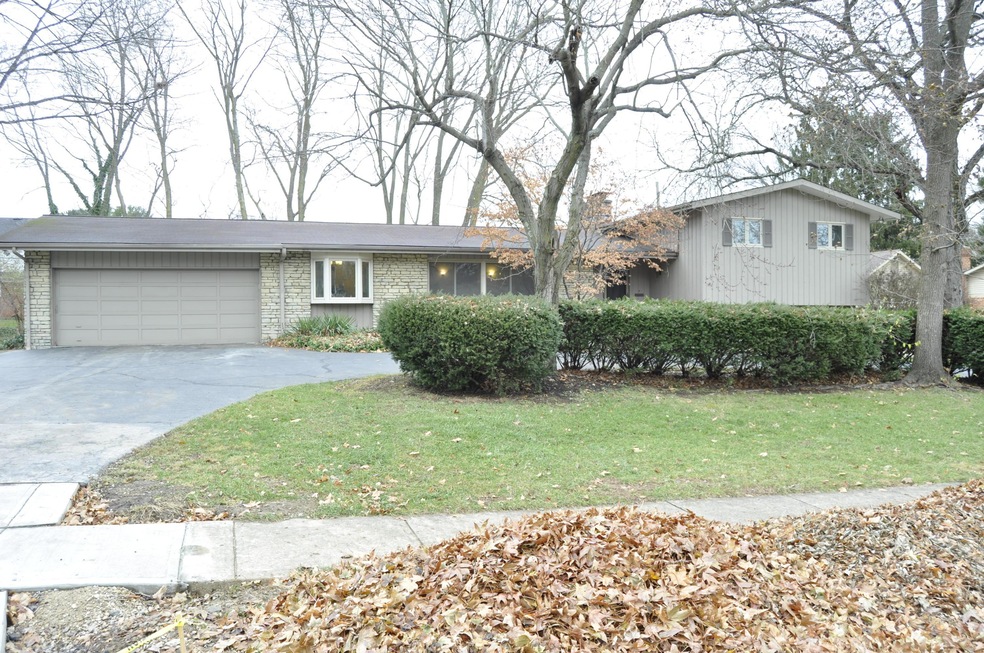
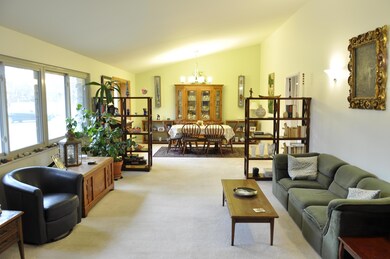
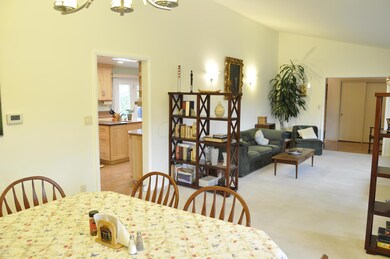
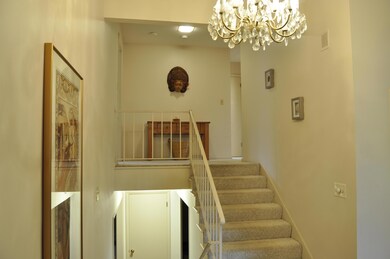
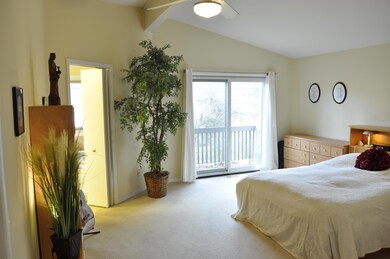
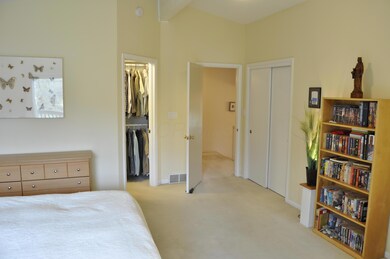
AVAILABLE ON JUNE 6TH 2019 FOR NO MORE THAN A ONE YEAR LEASE ONLY/ 4-Level home with stone and wood front in Shelbourne Heights. Renovated home with four beds, three and a half baths, large eat in kitchen with walk out to a large deck and walkout lower level with kitchenette walks out to a large patio. With ease of access to Riverside Drive, this home is moments away from everything Upper Arlington has to offer, OSU and downtown.
Last Agent to Rent the Property
KW Classic Properties Realty License #298441 Listed on: 02/08/2019
Last Renter's Agent
KW Classic Properties Realty License #298441 Listed on: 02/08/2019
| Date | Buyer | Sale Price | Title Company |
|---|---|---|---|
| Miller James H | $179,900 | -- |
| Date | Event | Price | List to Sale | Price per Sq Ft | Prior Sale |
|---|---|---|---|---|---|
| 03/27/2025 03/27/25 | Off Market | $2,550 | -- | -- | |
| 06/02/2019 06/02/19 | Rented | $2,550 | +2.0% | -- | |
| 02/07/2019 02/07/19 | For Rent | $2,500 | 0.0% | -- | |
| 08/01/2012 08/01/12 | Sold | $390,000 | -6.9% | $126 / Sq Ft | View Prior Sale |
| 07/02/2012 07/02/12 | Pending | -- | -- | -- | |
| 04/25/2012 04/25/12 | For Sale | $419,000 | -- | $136 / Sq Ft |
| Year | Tax Paid | Tax Assessment Tax Assessment Total Assessment is a certain percentage of the fair market value that is determined by local assessors to be the total taxable value of land and additions on the property. | Land | Improvement |
|---|---|---|---|---|
| 2025 | $12,299 | $212,170 | $80,360 | $131,810 |
| 2024 | $12,299 | $212,170 | $80,360 | $131,810 |
| 2023 | $12,190 | $212,170 | $80,360 | $131,810 |
| 2022 | $18,595 | $183,090 | $59,400 | $123,690 |
| 2021 | $11,325 | $183,090 | $59,400 | $123,690 |
| 2020 | $11,539 | $183,090 | $59,400 | $123,690 |
| 2019 | $10,432 | $150,300 | $59,400 | $90,900 |
| 2018 | $9,855 | $150,300 | $59,400 | $90,900 |
| 2017 | $10,342 | $150,300 | $59,400 | $90,900 |
| 2016 | $9,354 | $141,480 | $47,570 | $93,910 |
| 2015 | $9,346 | $141,480 | $47,570 | $93,910 |
| 2014 | $9,357 | $141,480 | $47,570 | $93,910 |
| 2013 | $4,467 | $128,590 | $43,225 | $85,365 |
Landlord's Agent in 2019
JoAnne Schorsten
KW Classic Properties Realty
(614) 792-1199
7 in this area
53 Total Sales
C
Seller's Agent in 2012
Cynthia Street
CR Inactive Office
Source: Columbus and Central Ohio Regional MLS
MLS Number: 219003518
APN: 070-009994
Disclaimer: Certain information contained herein is derived from information provided by parties other than Homes.com. All information provided is deemed reliable, but is not guaranteed to be accurate and should be independently verified.
![]() IDX information is provided exclusively for personal, non-commercial use, and may not be used for any purpose other than to identify prospective properties consumers may be interested in purchasing.
IDX information is provided exclusively for personal, non-commercial use, and may not be used for any purpose other than to identify prospective properties consumers may be interested in purchasing.
Information is deemed reliable but not guaranteed.
Ask me questions while you tour the home.