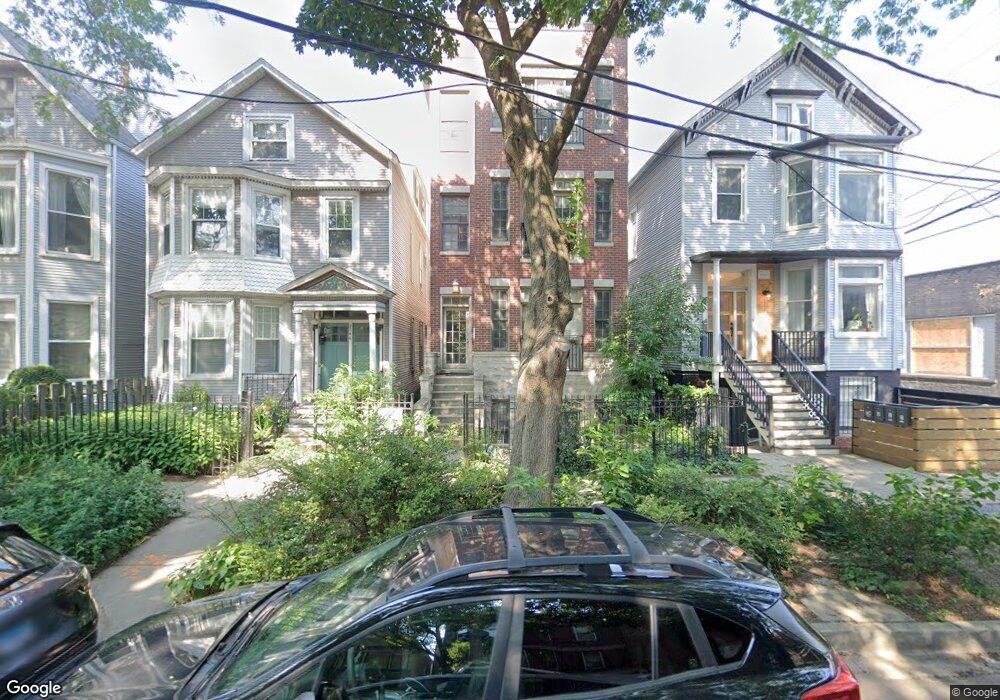
2750 N Seminary Ave Unit 1 Chicago, IL 60614
Sheffield & DePaul NeighborhoodEstimated Value: $622,000 - $1,004,737
2
Beds
3
Baths
1,200
Sq Ft
$620/Sq Ft
Est. Value
About This Home
This home is located at 2750 N Seminary Ave Unit 1, Chicago, IL 60614 and is currently estimated at $744,434, approximately $620 per square foot. 2750 N Seminary Ave Unit 1 is a home located in Cook County with nearby schools including Harriet Tubman Elementary School, Lincoln Park High School, and Alphonsus Academy & Center For The Arts.
Ownership History
Date
Name
Owned For
Owner Type
Purchase Details
Closed on
Dec 10, 2014
Sold by
Kauffman Laura
Bought by
Kauffman Laura and Kauffman Kurt
Current Estimated Value
Purchase Details
Closed on
Jan 11, 2010
Sold by
Collins William J
Bought by
Federal Home Loan Mortgage Corp
Purchase Details
Closed on
Sep 17, 2001
Sold by
Vanedward F
Bought by
Beakley Dean
Home Financials for this Owner
Home Financials are based on the most recent Mortgage that was taken out on this home.
Original Mortgage
$264,000
Interest Rate
6.37%
Purchase Details
Closed on
May 17, 2001
Sold by
Vanedward F
Bought by
Collins William J
Home Financials for this Owner
Home Financials are based on the most recent Mortgage that was taken out on this home.
Original Mortgage
$350,000
Interest Rate
7.23%
Create a Home Valuation Report for This Property
The Home Valuation Report is an in-depth analysis detailing your home's value as well as a comparison with similar homes in the area
Home Values in the Area
Average Home Value in this Area
Purchase History
| Date | Buyer | Sale Price | Title Company |
|---|---|---|---|
| Kauffman Laura | -- | None Available | |
| Federal Home Loan Mortgage Corp | -- | None Available | |
| Beakley Dean | $330,000 | -- | |
| Collins William J | $450,000 | Chicago Title Insurance Co |
Source: Public Records
Mortgage History
| Date | Status | Borrower | Loan Amount |
|---|---|---|---|
| Previous Owner | Beakley Dean | $264,000 | |
| Previous Owner | Collins William J | $350,000 | |
| Closed | Beakley Dean | $16,500 |
Source: Public Records
Tax History Compared to Growth
Tax History
| Year | Tax Paid | Tax Assessment Tax Assessment Total Assessment is a certain percentage of the fair market value that is determined by local assessors to be the total taxable value of land and additions on the property. | Land | Improvement |
|---|---|---|---|---|
| 2024 | $20,399 | $76,880 | $26,594 | $50,286 |
| 2023 | $19,865 | $100,000 | $21,447 | $78,553 |
| 2022 | $19,865 | $100,000 | $21,447 | $78,553 |
| 2021 | $19,439 | $99,999 | $21,447 | $78,552 |
| 2020 | $11,140 | $53,109 | $10,294 | $42,815 |
| 2019 | $10,892 | $57,642 | $10,294 | $47,348 |
| 2018 | $10,708 | $57,642 | $10,294 | $47,348 |
| 2017 | $10,069 | $50,149 | $9,150 | $40,999 |
| 2016 | $9,544 | $50,149 | $9,150 | $40,999 |
| 2015 | $8,709 | $50,149 | $9,150 | $40,999 |
| 2014 | $7,287 | $40,955 | $7,756 | $33,199 |
| 2013 | $10,137 | $58,365 | $7,756 | $50,609 |
Source: Public Records
Map
Nearby Homes
- 2773 N Kenmore Ave Unit 1
- 2820 N Sheffield Ave Unit 4N
- 2730 N Lincoln Ave Unit 2
- 2727 N Kenmore Ave Unit 1
- 2729 N Sheffield Ave Unit 1S
- 1132 W Wolfram St Unit 3
- 2654 N Lincoln Ave
- 2832 N Racine Ave Unit 2W
- 2832 N Racine Ave Unit 1W
- 2832 N Racine Ave Unit 2E
- 2832 N Racine Ave Unit 1E
- 2922 N Sheffield Ave Unit 3
- 2846 N Racine Ave Unit 3
- 2653 N Wilton Ave
- 2730 N Magnolia Ave Unit 32
- 2941 N Sheffield Ave Unit 1
- 2918 N Racine Ave
- 2622 N Racine Ave Unit 3
- 2711 N Mildred Ave Unit 3A
- 1100 W Wellington Ave
- 2746 N Seminary Ave
- 2746 N Seminary Ave
- 2746 N Seminary Ave Unit 1
- 2744 N Seminary Ave
- 2744 N Seminary Ave Unit 2
- 2744 N Seminary Ave Unit 1
- 2744 N Seminary Ave Unit 15A
- 2744 N Seminary Ave
- 2750 N Seminary Ave Unit 3
- 2750 N Seminary Ave Unit 2
- 2742 N Seminary Ave
- 2742 N Seminary Ave Unit G
- 2742 N Seminary Ave Unit CH2
- 2752 N Seminary Ave
- 2740 N Seminary Ave Unit 2
- 2740 N Seminary Ave
- 2740 N Seminary Ave Unit 1
- 2740 N Seminary Ave Unit 3
- 2736 N Seminary Ave Unit D
- 2736 N Seminary Ave Unit E1