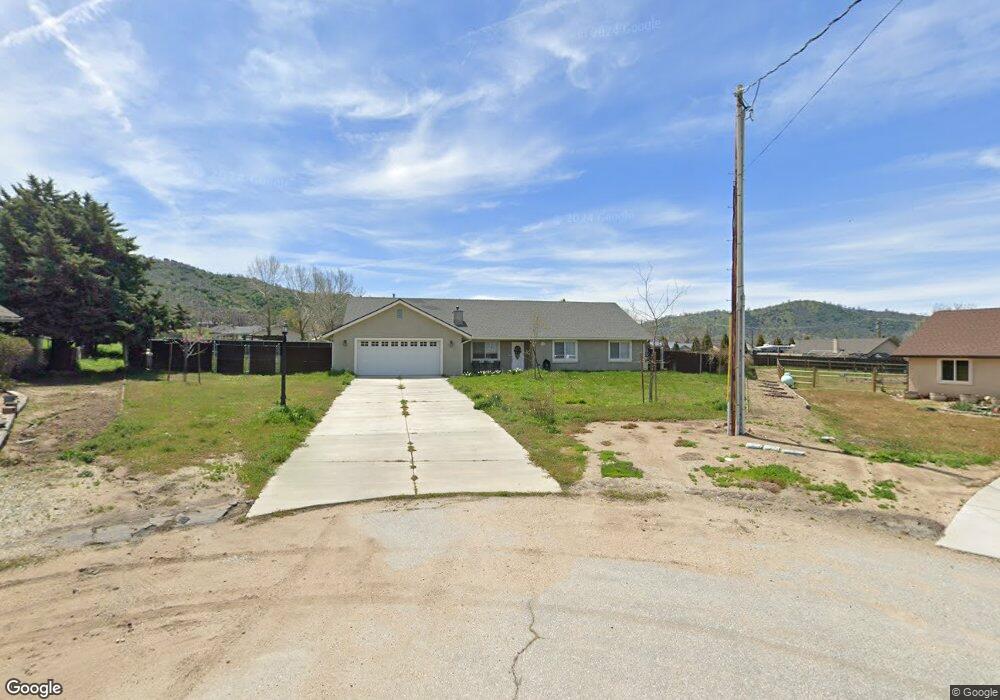
27500 Devil Diver Ct Tehachapi, CA 93561
Estimated Value: $412,000 - $468,000
4
Beds
2
Baths
1,949
Sq Ft
$227/Sq Ft
Est. Value
About This Home
This home is located at 27500 Devil Diver Ct, Tehachapi, CA 93561 and is currently estimated at $441,908, approximately $226 per square foot. 27500 Devil Diver Ct is a home located in Kern County with nearby schools including Cummings Valley Elementary School, Jacobsen Middle School, and Tehachapi High School.
Ownership History
Date
Name
Owned For
Owner Type
Purchase Details
Closed on
Oct 27, 2023
Sold by
Dressel Property Llc
Bought by
Irvin Thaer Anthony and Irvin Sara Lyn
Current Estimated Value
Home Financials for this Owner
Home Financials are based on the most recent Mortgage that was taken out on this home.
Original Mortgage
$382,206
Outstanding Balance
$367,275
Interest Rate
4%
Mortgage Type
VA
Estimated Equity
$74,633
Purchase Details
Closed on
Jan 28, 2010
Sold by
Dressel Jack and Dressel Jennifer
Bought by
Dressel Properties Llc
Purchase Details
Closed on
Dec 5, 2008
Sold by
Homesales Inc
Bought by
Dressel Jack and Dressel Jennifer
Purchase Details
Closed on
Jul 16, 2008
Sold by
Huebner Heath M and Huebner Denise J
Bought by
Homesales Inc
Purchase Details
Closed on
Jan 10, 2006
Sold by
Ama Homes Inc
Bought by
Huebner Heath M and Huebner Denise J
Home Financials for this Owner
Home Financials are based on the most recent Mortgage that was taken out on this home.
Original Mortgage
$317,346
Interest Rate
6.25%
Mortgage Type
Fannie Mae Freddie Mac
Purchase Details
Closed on
May 31, 2005
Sold by
Vance Michelle Marie
Bought by
Ama Homes Inc
Create a Home Valuation Report for This Property
The Home Valuation Report is an in-depth analysis detailing your home's value as well as a comparison with similar homes in the area
Home Values in the Area
Average Home Value in this Area
Purchase History
| Date | Buyer | Sale Price | Title Company |
|---|---|---|---|
| Irvin Thaer Anthony | $374,500 | Chicago Title Company | |
| Dressel Properties Llc | -- | None Available | |
| Dressel Jack | $200,000 | Chicago Title Company | |
| Homesales Inc | $208,250 | Accommodation | |
| Huebner Heath M | $304,000 | Chicago Title | |
| Ama Homes Inc | $48,000 | First American Title |
Source: Public Records
Mortgage History
| Date | Status | Borrower | Loan Amount |
|---|---|---|---|
| Open | Irvin Thaer Anthony | $382,206 | |
| Previous Owner | Huebner Heath M | $317,346 |
Source: Public Records
Tax History
| Year | Tax Paid | Tax Assessment Tax Assessment Total Assessment is a certain percentage of the fair market value that is determined by local assessors to be the total taxable value of land and additions on the property. | Land | Improvement |
|---|---|---|---|---|
| 2025 | $4,758 | $381,684 | $76,500 | $305,184 |
| 2024 | $3,225 | $374,200 | $75,000 | $299,200 |
| 2023 | $3,225 | $246,886 | $43,418 | $203,468 |
| 2022 | $3,195 | $242,046 | $42,567 | $199,479 |
| 2021 | $3,160 | $237,301 | $41,733 | $195,568 |
| 2020 | $3,169 | $234,869 | $41,306 | $193,563 |
| 2019 | $3,168 | $234,869 | $41,306 | $193,563 |
| 2018 | $3,065 | $225,751 | $39,703 | $186,048 |
| 2017 | $3,061 | $221,325 | $38,925 | $182,400 |
| 2016 | $2,935 | $216,986 | $38,162 | $178,824 |
| 2015 | $2,852 | $213,727 | $37,589 | $176,138 |
| 2014 | $2,824 | $209,541 | $36,853 | $172,688 |
Source: Public Records
Map
Nearby Homes
- 18181 Bowie St
- 18140 Flare Dr
- 27712 Stallion Springs Dr
- 18461 Branding Iron Ct
- 18450 Branding Iron Ct
- 17841 Hambletonian Dr
- 17901 Hambletonian Dr
- 27980 Hialeah Dr
- 18441 Wrangler Way
- 17820 Bold Venture Dr
- 18101 Ghost Town St
- 27961 Stallion Springs Dr
- 0 Armed Ct
- 27500 Buckpasser Dr
- 17750 Arlington Place
- 17751 Arlington Place
- 18461 Santa Anita St
- 17701 Bold Venture Dr
- 17401 Bold Venture Dr
- 0 Bold Venture Unit WS24098286
- 27501 Devil Diver Ct
- 27460 Devil Diver Ct
- 27501 Challedon Ct
- 27461 Challedon Ct
- 27440 Devil Diver Ct
- 27450 Hialeah Dr
- 27441 Jaipur Ct
- 27460 Hialeah Dr
- 27440 Hialeah Dr
- 27480 Hialeah Dr
- 27420 Jaipur Ct
- 27430 Hialeah Dr
- 0 Challedon Ct
- 18261 Bowie St
- 27420 Hialeah Dr
- 18241 Bowie St
- 18301 Bowie St
- 27460 Challedon Ct
- 27410 Hialeah Dr
- 18201 Bowie St
Your Personal Tour Guide
Ask me questions while you tour the home.