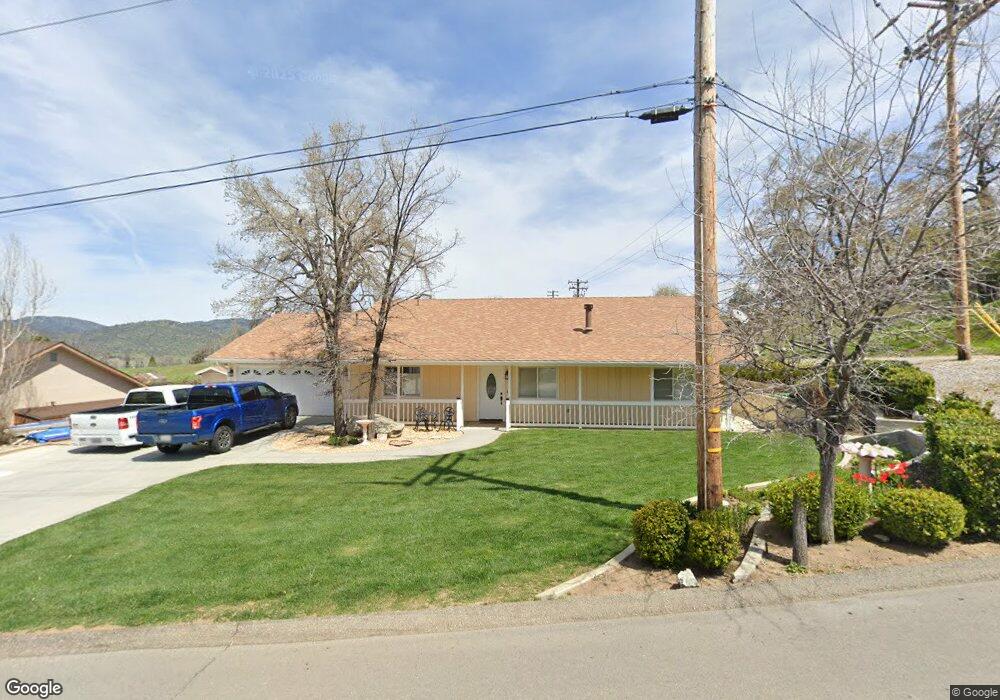
27501 Buckpasser Dr Tehachapi, CA 93561
Estimated Value: $327,000 - $406,000
3
Beds
2
Baths
1,302
Sq Ft
$275/Sq Ft
Est. Value
About This Home
This home is located at 27501 Buckpasser Dr, Tehachapi, CA 93561 and is currently estimated at $357,869, approximately $274 per square foot. 27501 Buckpasser Dr is a home located in Kern County with nearby schools including Cummings Valley Elementary School, Jacobsen Middle School, and Tehachapi High School.
Ownership History
Date
Name
Owned For
Owner Type
Purchase Details
Closed on
Apr 15, 2011
Sold by
Lundgren Angela
Bought by
Lundgren Jorgen
Current Estimated Value
Purchase Details
Closed on
Jul 8, 1999
Sold by
Jeanne Eaton Charles James and Jeanne Debra
Bought by
Orozco Gabriel and Orozco Irma
Home Financials for this Owner
Home Financials are based on the most recent Mortgage that was taken out on this home.
Original Mortgage
$68,000
Interest Rate
7.77%
Mortgage Type
Seller Take Back
Purchase Details
Closed on
Oct 29, 1997
Sold by
Hawkins Marilyn J
Bought by
Hawkins Richard D
Purchase Details
Closed on
Oct 8, 1997
Sold by
Hawkins Richard D
Bought by
Eaton Charles James and Eaton Debra Jeanne
Purchase Details
Closed on
Oct 29, 1993
Sold by
Kepler Martin Lee and Kepler Jodi Jill
Bought by
Hawkins Richard D
Create a Home Valuation Report for This Property
The Home Valuation Report is an in-depth analysis detailing your home's value as well as a comparison with similar homes in the area
Home Values in the Area
Average Home Value in this Area
Purchase History
| Date | Buyer | Sale Price | Title Company |
|---|---|---|---|
| Lundgren Jorgen | -- | Ticor Title | |
| Orozco Gabriel | $68,000 | -- | |
| Hawkins Richard D | -- | Commonwealth Land Title Co | |
| Eaton Charles James | $5,000 | Commonwealth Land Title | |
| Hawkins Richard D | -- | Fidelity National Title |
Source: Public Records
Mortgage History
| Date | Status | Borrower | Loan Amount |
|---|---|---|---|
| Previous Owner | Orozco Gabriel | $68,000 |
Source: Public Records
Tax History
| Year | Tax Paid | Tax Assessment Tax Assessment Total Assessment is a certain percentage of the fair market value that is determined by local assessors to be the total taxable value of land and additions on the property. | Land | Improvement |
|---|---|---|---|---|
| 2025 | $1,519 | $104,487 | $7,671 | $96,816 |
| 2024 | $1,470 | $102,439 | $7,521 | $94,918 |
| 2023 | $1,470 | $100,431 | $7,374 | $93,057 |
| 2022 | $1,450 | $98,463 | $7,230 | $91,233 |
| 2021 | $1,401 | $96,534 | $7,089 | $89,445 |
| 2020 | $1,390 | $95,545 | $7,017 | $88,528 |
| 2019 | $1,388 | $95,545 | $7,017 | $88,528 |
| 2018 | $1,348 | $91,838 | $6,746 | $85,092 |
| 2017 | $1,344 | $90,038 | $6,614 | $83,424 |
| 2016 | $1,264 | $88,274 | $6,485 | $81,789 |
| 2015 | $1,263 | $86,949 | $6,388 | $80,561 |
| 2014 | $1,251 | $85,246 | $6,263 | $78,983 |
Source: Public Records
Map
Nearby Homes
- 17820 Bold Venture Dr
- 27500 Buckpasser Dr
- 0 Armed Ct
- 17841 Hambletonian Dr
- 17901 Hambletonian Dr
- 17750 Arlington Place
- 0 Bold Venture Unit WS24098286
- 17751 Arlington Place
- 17401 Bold Venture Dr
- 27980 Hialeah Dr
- 17600 Ascot Ct
- 17701 Bold Venture Dr
- 18181 Bowie St
- 18140 Flare Dr
- 27712 Stallion Springs Dr
- 17821 Cavan Ct
- 27961 Stallion Springs Dr
- 17161 Bold Venture Dr
- 18101 Ghost Town St
- 18461 Branding Iron Ct
- 27541 Buckpasser Dr
- 27551 Buckpasser Dr
- 17700 Bold Venture Dr
- 27540 Buckpasser Dr
- 0 Bold Venture Dr Unit 9992612
- 0 Bold Venture Dr Unit 9992611
- 0 Bold Venture Dr Unit 202402605
- 0 Bold Venture Dr Unit 9955755
- 0 Bold Venture Dr Unit 9953727
- 0 Bold Venture Dr Unit 9952513
- 0 Bold Venture Dr Unit SR23170030
- 0 Bold Venture Dr Unit 23006290
- 0 Bold Venture Dr Unit 21005195
- 0 Bold Venture Dr Unit 21608740
- 0 Bold Venture Dr Unit 21909342
- 0 Bold Venture Dr Unit 202102533
- 0 Bold Venture Dr Unit 9960118
- 0 Bold Venture Dr Unit 9962844
- 0 Bold Venture Dr Unit 9962842
- 0 Bold Venture Dr Unit 9963442
Your Personal Tour Guide
Ask me questions while you tour the home.