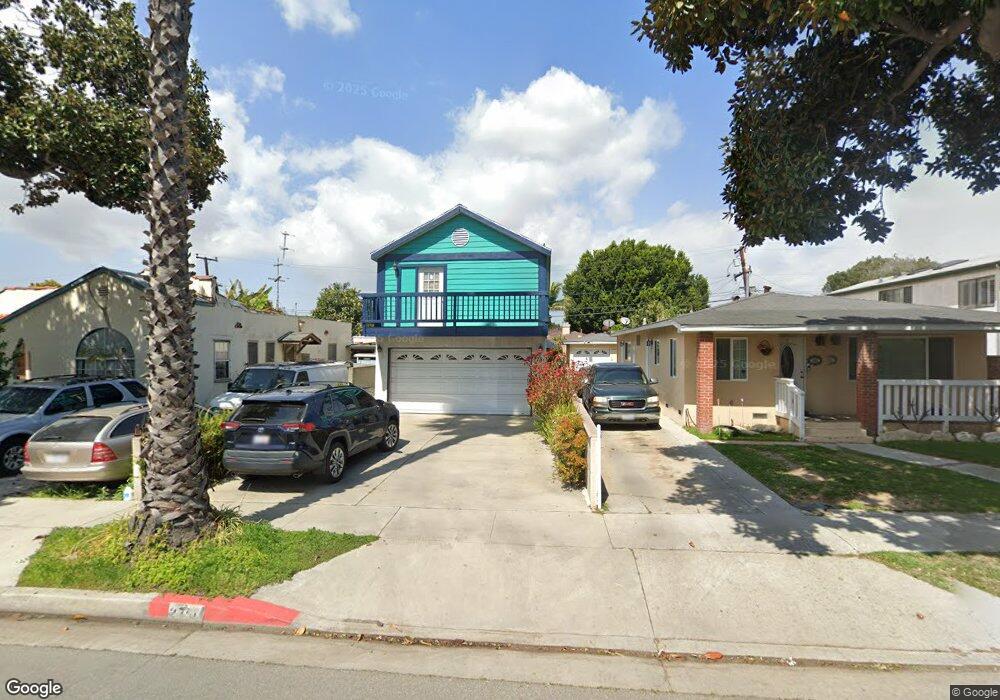
2751 E Van Buren St Long Beach, CA 90810
Estimated Value: $768,000 - $906,000
4
Beds
3
Baths
1,960
Sq Ft
$419/Sq Ft
Est. Value
About This Home
This home is located at 2751 E Van Buren St, Long Beach, CA 90810 and is currently estimated at $821,216, approximately $418 per square foot. 2751 E Van Buren St is a home located in Los Angeles County with nearby schools including Dominguez Elementary School, Rancho Dominguez Preparatory School, and Pacific Baptist School.
Ownership History
Date
Name
Owned For
Owner Type
Purchase Details
Closed on
Aug 5, 2023
Sold by
Perez Erick Enrique
Bought by
Perez Family Trust and Perez
Current Estimated Value
Purchase Details
Closed on
Mar 11, 2002
Sold by
Hansen Gary R
Bought by
Hansen Karen
Home Financials for this Owner
Home Financials are based on the most recent Mortgage that was taken out on this home.
Original Mortgage
$141,000
Interest Rate
6.85%
Purchase Details
Closed on
Jul 2, 1997
Sold by
Evangelista Joyce M
Bought by
Casiano Victoria J and Justiniano Myrna
Home Financials for this Owner
Home Financials are based on the most recent Mortgage that was taken out on this home.
Original Mortgage
$138,204
Interest Rate
7.58%
Mortgage Type
FHA
Create a Home Valuation Report for This Property
The Home Valuation Report is an in-depth analysis detailing your home's value as well as a comparison with similar homes in the area
Home Values in the Area
Average Home Value in this Area
Purchase History
| Date | Buyer | Sale Price | Title Company |
|---|---|---|---|
| Perez Family Trust | -- | None Listed On Document | |
| Hansen Karen | -- | Commonwealth Title | |
| Perez Erick | -- | Commonwealth Title | |
| Hansen Karen | -- | Commonwealth Title | |
| Casiano Victoria J | -- | -- | |
| Peralta Karen | $140,000 | -- |
Source: Public Records
Mortgage History
| Date | Status | Borrower | Loan Amount |
|---|---|---|---|
| Previous Owner | Hansen Karen | $141,000 | |
| Previous Owner | Peralta Karen | $138,204 |
Source: Public Records
Tax History
| Year | Tax Paid | Tax Assessment Tax Assessment Total Assessment is a certain percentage of the fair market value that is determined by local assessors to be the total taxable value of land and additions on the property. | Land | Improvement |
|---|---|---|---|---|
| 2025 | $3,863 | $258,517 | $97,508 | $161,009 |
| 2024 | $3,863 | $253,449 | $95,597 | $157,852 |
| 2023 | $3,782 | $248,480 | $93,723 | $154,757 |
| 2022 | $3,600 | $243,609 | $91,886 | $151,723 |
| 2021 | $3,547 | $238,834 | $90,085 | $148,749 |
| 2019 | $3,410 | $231,752 | $87,414 | $144,338 |
| 2018 | $3,340 | $227,208 | $85,700 | $141,508 |
| 2016 | $3,187 | $218,387 | $82,373 | $136,014 |
| 2015 | $3,118 | $215,107 | $81,136 | $133,971 |
| 2014 | $3,108 | $210,894 | $79,547 | $131,347 |
Source: Public Records
Map
Nearby Homes
- 2650 E Dominguez St
- 2601 E Van Buren St
- 2548 E Washington St
- 2650 E 220th St
- 630 W Devon Place
- 1801 W Cameron St
- 627 Avery Place
- 4116 Del Mar Ave
- 2216 W Wardlow Rd
- 4841 Holly Ave Unit 114
- 4925 Holly Ave
- 4907 Brook Ave
- 1924 W Arlington St
- 3593 Santa fe Ave Unit 213
- 3595 Santa fe Ave Unit 73
- 3595 Santa fe Ave Unit 291
- 3595 Santa fe Ave Unit 162
- 3595 Santa fe Ave Unit 115
- 4217 Cedar Ave
- 4275 Country Club Dr
- 2747 E Van Buren St
- 2753 E Van Buren St
- 2745 E Van Buren St
- 2755 E Van Buren St
- 2759 E Van Buren St
- 2752 E Harrison St
- 2748 E Harrison St
- 2743 E Van Buren St
- 2746 E Harrison St
- 2754 E Harrison St
- 2761 E Van Buren St
- 2742 E Harrison St
- 2760 E Harrison St
- 2737 E Van Buren St
- 2748 E Van Buren St
- 2754 E Van Buren St
- 2758 E Van Buren St
- 2736 E Harrison St
- 2738 E Van Buren St
- 2735 E Van Buren St