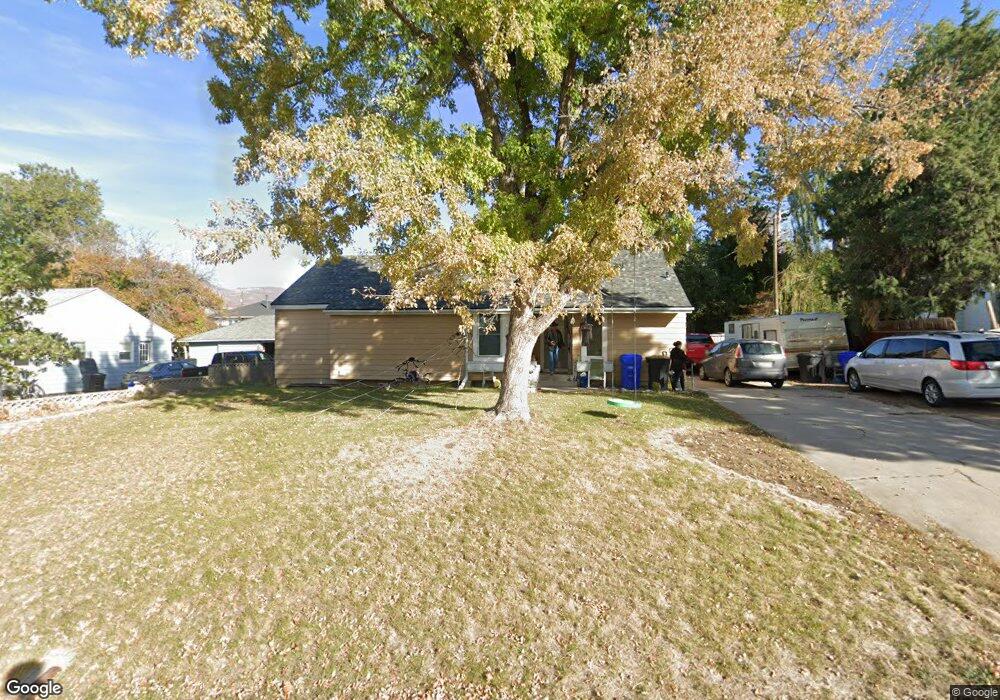
2753 S 300 W Bountiful, UT 84010
Estimated Value: $477,000 - $543,000
4
Beds
2
Baths
1,168
Sq Ft
$440/Sq Ft
Est. Value
About This Home
This home is located at 2753 S 300 W, Bountiful, UT 84010 and is currently estimated at $513,616, approximately $439 per square foot. 2753 S 300 W is a home located in Davis County with nearby schools including Boulton School, South Davis Junior High School, and Woods Cross High School.
Ownership History
Date
Name
Owned For
Owner Type
Purchase Details
Closed on
Jan 3, 2022
Sold by
Erazo Marie A
Bought by
Erazo Marie A
Current Estimated Value
Home Financials for this Owner
Home Financials are based on the most recent Mortgage that was taken out on this home.
Original Mortgage
$260,000
Outstanding Balance
$239,164
Interest Rate
3.12%
Mortgage Type
New Conventional
Estimated Equity
$274,452
Purchase Details
Closed on
Oct 14, 2008
Sold by
Mcalister Marie
Bought by
Erazo Marie A
Home Financials for this Owner
Home Financials are based on the most recent Mortgage that was taken out on this home.
Original Mortgage
$157,950
Interest Rate
6.31%
Mortgage Type
FHA
Purchase Details
Closed on
Sep 4, 1998
Sold by
Mcalister Marie
Bought by
Mcalister Marie
Home Financials for this Owner
Home Financials are based on the most recent Mortgage that was taken out on this home.
Original Mortgage
$63,000
Interest Rate
6.92%
Purchase Details
Closed on
Jan 12, 1998
Sold by
Searcy Joy M
Bought by
Mcalister Marie
Create a Home Valuation Report for This Property
The Home Valuation Report is an in-depth analysis detailing your home's value as well as a comparison with similar homes in the area
Home Values in the Area
Average Home Value in this Area
Purchase History
| Date | Buyer | Sale Price | Title Company |
|---|---|---|---|
| Erazo Marie A | -- | Stewart Title Ins Agency | |
| Erazo Marie A | -- | First American Title | |
| Mcalister Marie | -- | Bonneville Title Company Inc | |
| Mcalister Marie | -- | -- |
Source: Public Records
Mortgage History
| Date | Status | Borrower | Loan Amount |
|---|---|---|---|
| Open | Erazo Marie A | $260,000 | |
| Closed | Erazo Marie A | $157,950 | |
| Previous Owner | Mcalister Marie | $63,000 |
Source: Public Records
Tax History Compared to Growth
Tax History
| Year | Tax Paid | Tax Assessment Tax Assessment Total Assessment is a certain percentage of the fair market value that is determined by local assessors to be the total taxable value of land and additions on the property. | Land | Improvement |
|---|---|---|---|---|
| 2025 | $2,735 | $242,550 | $171,318 | $71,232 |
| 2024 | $2,637 | $238,150 | $166,811 | $71,339 |
| 2023 | $2,534 | $412,000 | $293,848 | $118,152 |
| 2022 | $2,477 | $226,050 | $157,060 | $68,990 |
| 2021 | $2,320 | $325,000 | $206,083 | $118,917 |
| 2020 | $2,045 | $286,000 | $171,387 | $114,613 |
| 2019 | $2,054 | $285,000 | $152,310 | $132,690 |
| 2018 | $1,907 | $260,000 | $148,701 | $111,299 |
| 2016 | $1,435 | $114,675 | $63,630 | $51,045 |
| 2015 | $1,324 | $100,100 | $63,630 | $36,470 |
| 2014 | $1,305 | $100,877 | $63,630 | $37,247 |
| 2013 | -- | $100,806 | $46,985 | $53,821 |
Source: Public Records
Map
Nearby Homes
- 2943 S 400 W
- 117 W 3000 S
- 3183 S 500 W
- 527 Applewood Dr
- 2095 S Main St Unit 17
- 2095 S Main St Unit 23
- 217 E 3000 S
- 33 W Wicker Ln
- 1950 S 200 W Unit 32
- 3463 S 50 E
- 3474 S 100 E
- 8 E 3500 S
- 2281 S 250 E
- 3238 S 675 W
- 269 E 2200 S
- 3716 S Oakridge Cir
- 320 E 2100 S
- 438 Indian Springs Rd
- 296 E 2050 S Unit 2
- 757 W 3200 S