2755 Stearns St Unit 14 Simi Valley, CA 93063
East Simi Valley NeighborhoodEstimated Value: $608,643 - $683,000
2
Beds
3
Baths
1,542
Sq Ft
$418/Sq Ft
Est. Value
About This Home
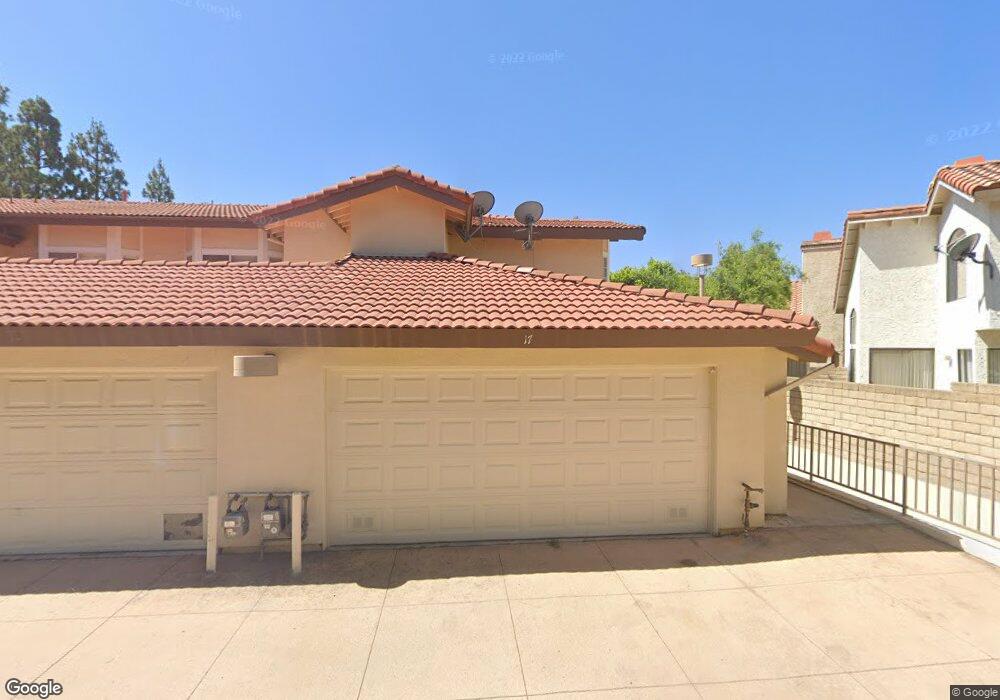
This home is located at 2755 Stearns St Unit 14, Simi Valley, CA 93063 and is currently estimated at $644,161, approximately $417 per square foot. 2755 Stearns St Unit 14 is a home located in Ventura County with nearby schools including Santa Susana Elementary School, Valley View Middle School, and Simi Valley High School.
Ownership History
Date
Name
Owned For
Owner Type
Purchase Details
Closed on
May 11, 2004
Sold by
Casano Peter
Bought by
Casano Peter and Casano Jennifer
Current Estimated Value
Home Financials for this Owner
Home Financials are based on the most recent Mortgage that was taken out on this home.
Original Mortgage
$140,000
Interest Rate
5.77%
Mortgage Type
New Conventional
Purchase Details
Closed on
May 5, 1995
Sold by
The Federal Home Loan Mtg Corp
Bought by
Casano Peter
Home Financials for this Owner
Home Financials are based on the most recent Mortgage that was taken out on this home.
Original Mortgage
$117,325
Interest Rate
8.47%
Purchase Details
Closed on
Feb 10, 1995
Sold by
Federal Home Loan Mortgage Corporation
Bought by
Federal Home Loan Mortgage Corporation
Purchase Details
Closed on
Jun 10, 1994
Sold by
Randall Craig D and Randall Cynthia Severe
Bought by
Westmont Townhomes Owners Assn
Create a Home Valuation Report for This Property
The Home Valuation Report is an in-depth analysis detailing your home's value as well as a comparison with similar homes in the area
Home Values in the Area
Average Home Value in this Area
Purchase History
| Date | Buyer | Sale Price | Title Company |
|---|---|---|---|
| Casano Peter | -- | Lawyers Title Company | |
| Casano Peter | $123,500 | Fidelity National Title | |
| Federal Home Loan Mortgage Corporation | $125,000 | Fidelity National Title Ins | |
| Federal Home Loan Mortgage Corporation | $125,000 | Fidelity National Title Ins | |
| Westmont Townhomes Owners Assn | -- | -- |
Source: Public Records
Mortgage History
| Date | Status | Borrower | Loan Amount |
|---|---|---|---|
| Closed | Casano Peter | $140,000 | |
| Closed | Casano Peter | $117,325 |
Source: Public Records
Tax History Compared to Growth
Tax History
| Year | Tax Paid | Tax Assessment Tax Assessment Total Assessment is a certain percentage of the fair market value that is determined by local assessors to be the total taxable value of land and additions on the property. | Land | Improvement |
|---|---|---|---|---|
| 2025 | $2,790 | $207,397 | $82,956 | $124,441 |
| 2024 | $2,790 | $203,331 | $81,330 | $122,001 |
| 2023 | $2,623 | $199,345 | $79,736 | $119,609 |
| 2022 | $2,600 | $195,437 | $78,173 | $117,264 |
| 2021 | $2,570 | $191,605 | $76,640 | $114,965 |
| 2020 | $2,509 | $189,642 | $75,855 | $113,787 |
| 2019 | $2,388 | $185,924 | $74,368 | $111,556 |
| 2018 | $2,361 | $182,279 | $72,910 | $109,369 |
| 2017 | $2,303 | $178,706 | $71,481 | $107,225 |
| 2016 | $2,198 | $175,203 | $70,080 | $105,123 |
| 2015 | $2,146 | $172,573 | $69,028 | $103,545 |
| 2014 | $2,126 | $169,195 | $67,677 | $101,518 |
Source: Public Records
Map
Nearby Homes
- 2711 Stearns St Unit 4
- 2702 Titania Place
- 5206 Seneca Place
- 5406 Maricopa Dr
- 2511 Aurora Ln
- 2547 Canterbury Ln
- 2948 Texas Ave
- 4989 Cochran St
- 4790 Adam Rd
- 2945 Dalhart Ave
- 40 Hanna
- 4759 Del Rio Dr
- 25 Chivo
- 26 Chivo
- 27 Chivo
- 28 Chivo
- 62 Las Lljas Canyon Rd
- 125 Fern Dr
- 0 American Cut Off (Apn 649-0-020-010) Rd Unit SR25060657
- 4676 Kleberg St
- 2755 Stearns St Unit 17
- 2755 Stearns St Unit 16
- 2755 Stearns St Unit 15
- 2755 Stearns St Unit 13
- 2743 Stearns St Unit 10
- 2743 Stearns St Unit 9
- 2743 Stearns St Unit 8
- 2743 Stearns St Unit 7
- 2719 Stearns St Unit 12
- 2719 Stearns St Unit 11
- 2731 Stearns St
- 2731 Stearns St Unit 6
- 2731 Stearns St Unit 5
- 2766 Annandale Ln Unit 10
- 2758 Annandale Ln
- 2752 Annandale Ln
- 2753 Titania Place
- 2759 Titania Place
- 2744 Annandale Ln
- 2779 Stearns St Unit 20