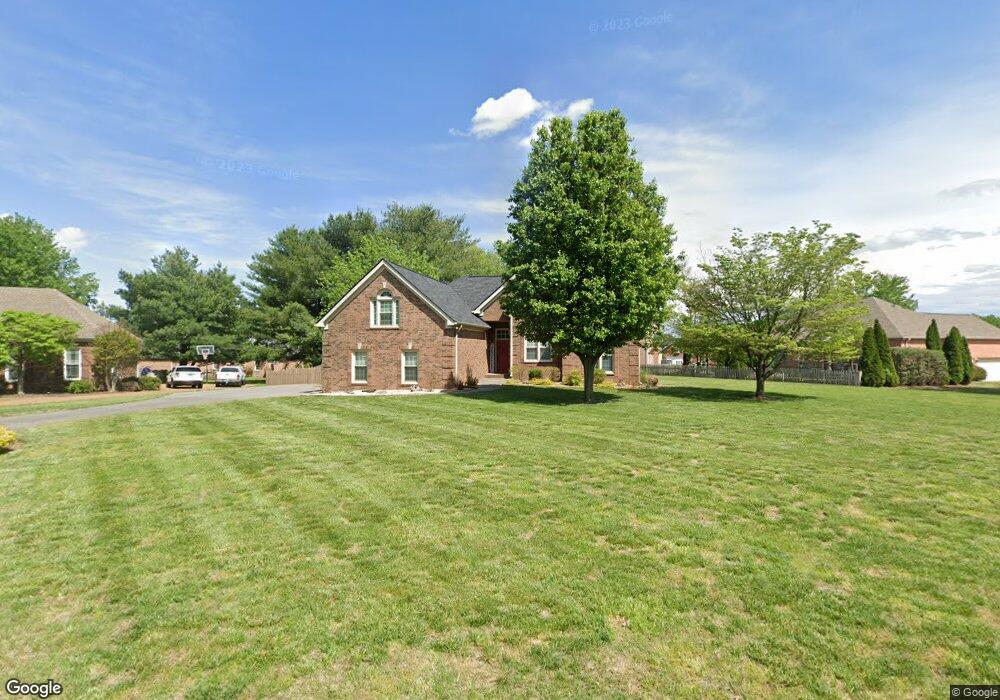
2756 Durham Ct Thompsons Station, TN 37179
Estimated Value: $458,818 - $525,000
--
Bed
3
Baths
1,670
Sq Ft
$299/Sq Ft
Est. Value
About This Home
This home is located at 2756 Durham Ct, Thompsons Station, TN 37179 and is currently estimated at $499,205, approximately $298 per square foot. 2756 Durham Ct is a home located in Williamson County with nearby schools including Primrose School of Spring Hill.
Ownership History
Date
Name
Owned For
Owner Type
Purchase Details
Closed on
Sep 30, 2011
Sold by
Rickman Wilbur E and Rickman Donna J
Bought by
Henegar James Perry
Current Estimated Value
Purchase Details
Closed on
Nov 27, 1996
Sold by
Tenn Valley Homes Inc
Bought by
Rickman Wilbur E
Purchase Details
Closed on
Aug 16, 1996
Sold by
Pratt Builders Inc
Bought by
Tennessee Valley Homes Inc
Create a Home Valuation Report for This Property
The Home Valuation Report is an in-depth analysis detailing your home's value as well as a comparison with similar homes in the area
Home Values in the Area
Average Home Value in this Area
Purchase History
| Date | Buyer | Sale Price | Title Company |
|---|---|---|---|
| Henegar James Perry | $204,000 | None Available | |
| Rickman Wilbur E | $147,100 | -- | |
| Tennessee Valley Homes Inc | $26,500 | -- |
Source: Public Records
Tax History Compared to Growth
Tax History
| Year | Tax Paid | Tax Assessment Tax Assessment Total Assessment is a certain percentage of the fair market value that is determined by local assessors to be the total taxable value of land and additions on the property. | Land | Improvement |
|---|---|---|---|---|
| 2025 | $564 | $114,800 | $38,750 | $76,050 |
| 2024 | $564 | $76,325 | $20,000 | $56,325 |
| 2023 | $564 | $76,325 | $20,000 | $56,325 |
| 2022 | $1,397 | $76,325 | $20,000 | $56,325 |
| 2021 | $1,397 | $76,325 | $20,000 | $56,325 |
| 2020 | $1,246 | $57,675 | $15,000 | $42,675 |
| 2019 | $1,246 | $57,675 | $15,000 | $42,675 |
| 2018 | $1,205 | $57,675 | $15,000 | $42,675 |
| 2017 | $1,194 | $57,675 | $15,000 | $42,675 |
| 2016 | $1,177 | $57,675 | $15,000 | $42,675 |
| 2015 | -- | $48,375 | $12,500 | $35,875 |
| 2014 | -- | $48,375 | $12,500 | $35,875 |
Source: Public Records
Map
Nearby Homes
- 2127 Loudenslager Dr
- 2836 Pedigo Place
- 2112 Loudenslager Dr
- 2165 Loudenslager Dr
- 2104 Loudenslager Dr
- 403 Preakness Dr
- 2785 Rutland Ct
- 2863 Windy Way
- 2641 Buckner Rd
- 446 Buckwood Ave W
- 307 Buckwood Ln N
- 303 Buckwood Ln N
- 309 Buckwood Ln W
- 464 Buckwood Ave W
- 317 Buckwood Ln N
- 456 Buckwood Ave N
- 2184 Loudenslager Dr
- 301 Buckwood Ave N
- 455 Buckwood Ave W
- 460 Buckwood Ave
- 2748 Durham Ct
- 2760 Durham Ct
- 2733 New Port Royal Rd
- 2731 New Port Royal Rd
- 2764 Durham Ct
- 2751 Durham Ct
- 2759 Durham Ct
- 2755 Durham Ct
- 2729 New Port Royal Rd
- 2747 Durham Ct
- 2751 Durham Ct
- 2763 Durham Ct
- 2757 Wiltshire Ct
- 2753 Wiltshire Ct
- 2761 Wiltshire Ct
- 2710 Wales Ct
- 2743 New Port Royal Rd
- 2140 Loudenslager Dr
- 2749 Wiltshire Ct
- 2136 Loudenslager Dr