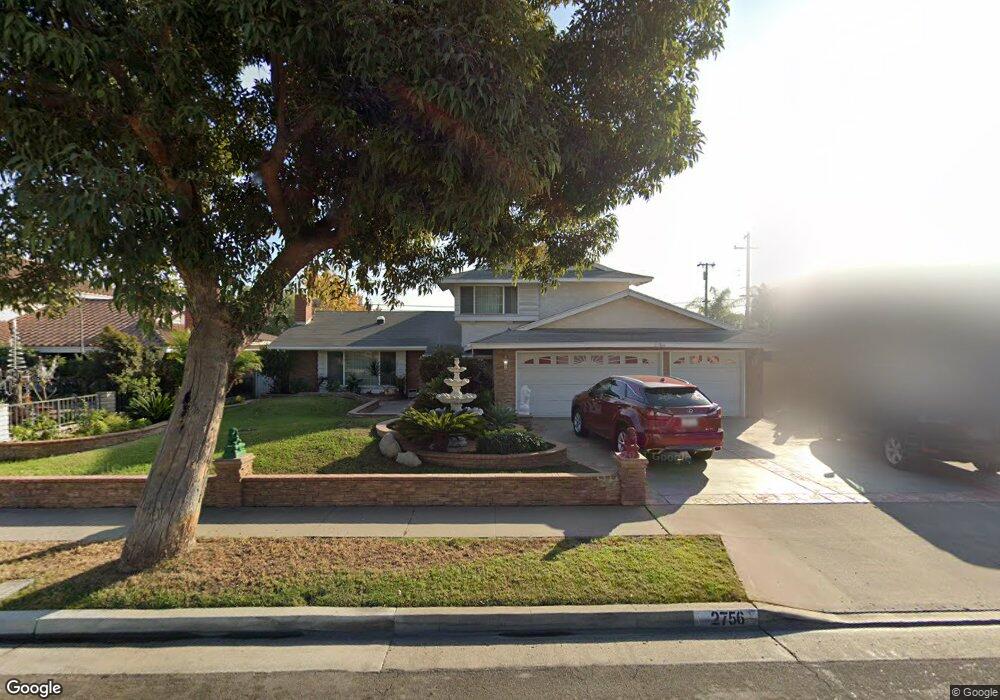
2756 W Westhaven Dr Anaheim, CA 92804
West Anaheim NeighborhoodEstimated Value: $1,011,000 - $1,170,000
4
Beds
2
Baths
2,168
Sq Ft
$505/Sq Ft
Est. Value
About This Home
This home is located at 2756 W Westhaven Dr, Anaheim, CA 92804 and is currently estimated at $1,094,771, approximately $504 per square foot. 2756 W Westhaven Dr is a home located in Orange County with nearby schools including Mattie Lou Maxwell Elementary School, Dale Jr High School, and Magnolia High.
Ownership History
Date
Name
Owned For
Owner Type
Purchase Details
Closed on
Aug 21, 2002
Sold by
Nguyen Jimmy and Xa Tina
Bought by
Nguyen Jimmy and Xa Tina
Current Estimated Value
Home Financials for this Owner
Home Financials are based on the most recent Mortgage that was taken out on this home.
Original Mortgage
$289,000
Interest Rate
6.29%
Purchase Details
Closed on
May 26, 1999
Sold by
Siggers Richard L and Siggers Shirley K
Bought by
Nguyen Jimmy Nelson and Xa Tina Cong
Home Financials for this Owner
Home Financials are based on the most recent Mortgage that was taken out on this home.
Original Mortgage
$212,000
Interest Rate
7.05%
Purchase Details
Closed on
May 27, 1994
Sold by
Chicago Title Company
Bought by
Siggers Richard L and Siggers Shirley K
Purchase Details
Closed on
May 19, 1994
Sold by
Seitz Phil Ip
Bought by
Professional Forclosure Counselor
Create a Home Valuation Report for This Property
The Home Valuation Report is an in-depth analysis detailing your home's value as well as a comparison with similar homes in the area
Home Values in the Area
Average Home Value in this Area
Purchase History
| Date | Buyer | Sale Price | Title Company |
|---|---|---|---|
| Nguyen Jimmy | -- | Fidelity National Title | |
| Nguyen Jimmy Nelson | $242,500 | Commonwealth Land Title | |
| Siggers Richard L | $132,140 | Chicago Title Company | |
| Professional Forclosure Counselor | -- | -- |
Source: Public Records
Mortgage History
| Date | Status | Borrower | Loan Amount |
|---|---|---|---|
| Closed | Nguyen Jimmy | $289,000 | |
| Closed | Nguyen Jimmy Nelson | $212,000 |
Source: Public Records
Tax History Compared to Growth
Tax History
| Year | Tax Paid | Tax Assessment Tax Assessment Total Assessment is a certain percentage of the fair market value that is determined by local assessors to be the total taxable value of land and additions on the property. | Land | Improvement |
|---|---|---|---|---|
| 2025 | $4,343 | $380,002 | $232,808 | $147,194 |
| 2024 | $4,343 | $372,551 | $228,243 | $144,308 |
| 2023 | $4,228 | $365,247 | $223,768 | $141,479 |
| 2022 | $4,185 | $358,086 | $219,381 | $138,705 |
| 2021 | $4,134 | $351,065 | $215,079 | $135,986 |
| 2020 | $4,110 | $347,466 | $212,874 | $134,592 |
| 2019 | $4,009 | $340,653 | $208,700 | $131,953 |
| 2018 | $3,959 | $333,974 | $204,608 | $129,366 |
| 2017 | $3,820 | $327,426 | $200,596 | $126,830 |
| 2016 | $3,800 | $321,006 | $196,662 | $124,344 |
| 2015 | $3,766 | $316,185 | $193,708 | $122,477 |
| 2014 | $3,578 | $309,992 | $189,914 | $120,078 |
Source: Public Records
Map
Nearby Homes
- 619 S Shields Dr
- 507 S Shields Dr
- 1234 S Macduff St
- 1223 S Dale Ave
- 2945 W Bridgeport Ave
- 837 S Magnolia Ave
- 2770 W Lincoln Ave Unit 29A
- 2770 W Lincoln Ave Unit 40
- 2770 W Lincoln Ave Unit 58
- 2550 W Rowland Ave
- 10211 Macduff St
- 2517 W Merle Place
- 2942 W Floyd Ave
- 716 S Hayward St Unit 2
- 8921 Kennelly Ln
- 134 S Magnolia Ave Unit 4C
- 900 S Hayward St
- 103 S Laxore St
- 106 S Laxore St Unit 407
- 107 S Laxore St
- 2750 W Westhaven Dr
- 2760 W Westhaven Dr
- 701 S Wasco Rd
- 2746 W Westhaven Dr
- 2766 W Westhaven Dr
- 629 S Shields Dr
- 705 S Wasco Rd
- 628 S Scott Ln
- 700 S Wasco Rd
- 700 S Yana Dr
- 704 S Yana Dr
- 2742 W Westhaven Dr
- 2770 W Westhaven Dr
- 623 S Shields Dr
- 622 S Scott Ln
- 704 S Wasco Rd
- 628 S Shields Dr
- 709 S Wasco Rd
- 708 S Yana Dr
- 629 S Scott Ln