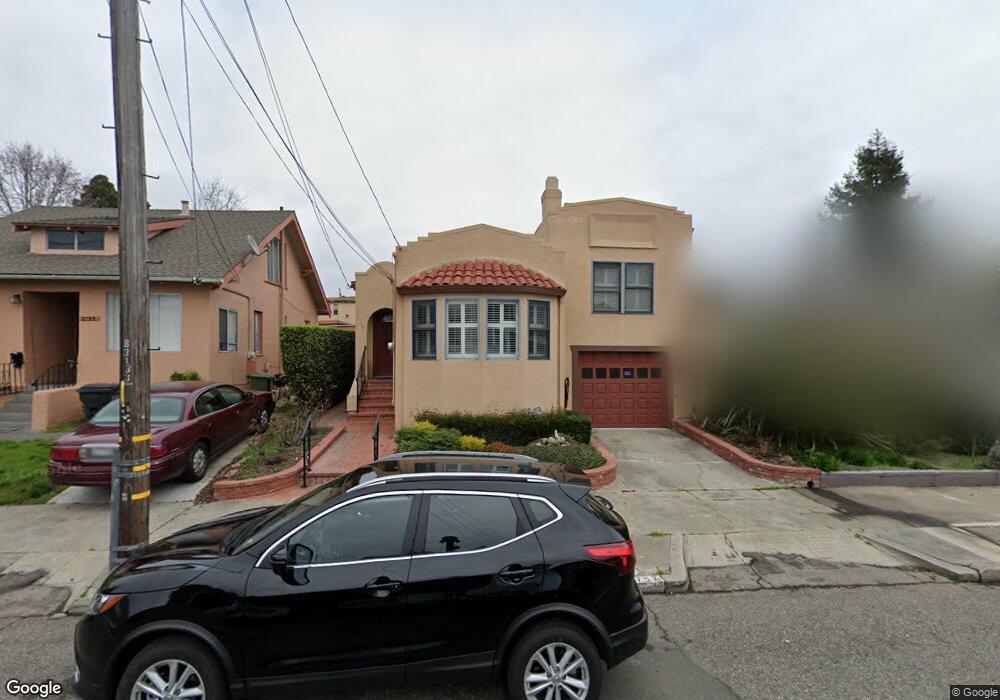
2757 Dohr St Berkeley, CA 94702
West Berkeley NeighborhoodEstimated Value: $1,410,769 - $1,648,000
4
Beds
3
Baths
2,426
Sq Ft
$629/Sq Ft
Est. Value
About This Home
This home is located at 2757 Dohr St, Berkeley, CA 94702 and is currently estimated at $1,526,692, approximately $629 per square foot. 2757 Dohr St is a home located in Alameda County with nearby schools including Malcolm X Elementary School, Washington Elementary School, and Oxford Elementary School.
Ownership History
Date
Name
Owned For
Owner Type
Purchase Details
Closed on
Jul 27, 2022
Sold by
Joseph Rucker Weldon
Bought by
Joseph Rucker Living Trust
Current Estimated Value
Create a Home Valuation Report for This Property
The Home Valuation Report is an in-depth analysis detailing your home's value as well as a comparison with similar homes in the area
Home Values in the Area
Average Home Value in this Area
Purchase History
| Date | Buyer | Sale Price | Title Company |
|---|---|---|---|
| Joseph Rucker Living Trust | -- | -- |
Source: Public Records
Tax History Compared to Growth
Tax History
| Year | Tax Paid | Tax Assessment Tax Assessment Total Assessment is a certain percentage of the fair market value that is determined by local assessors to be the total taxable value of land and additions on the property. | Land | Improvement |
|---|---|---|---|---|
| 2025 | $6,434 | $69,249 | $38,002 | $38,247 |
| 2024 | $6,434 | $67,755 | $37,257 | $37,498 |
| 2023 | $6,202 | $73,289 | $36,527 | $36,762 |
| 2022 | $6,139 | $64,853 | $35,811 | $36,042 |
| 2021 | $6,081 | $63,443 | $35,108 | $35,335 |
| 2020 | $5,532 | $69,721 | $34,748 | $34,973 |
| 2019 | $5,053 | $68,354 | $34,067 | $34,287 |
| 2018 | $4,880 | $67,014 | $33,399 | $33,615 |
| 2017 | $4,681 | $65,700 | $32,744 | $32,956 |
| 2016 | $4,325 | $64,412 | $32,102 | $32,310 |
| 2015 | $4,222 | $63,444 | $31,620 | $31,824 |
| 2014 | $4,094 | $62,202 | $31,001 | $31,201 |
Source: Public Records
Map
Nearby Homes
- 2790 Sacramento St
- 2782 Sacramento St
- 2774 Sacramento St
- 2728 Dohr St
- 2758 Sacramento St
- 1450 Ward St
- 2750 Sacramento St
- 1540 Stuart St
- 2922 Stanton St
- 2829 California St
- 1606 Derby St
- 2703 Mathews St
- 1314 Ashby Ave
- 1538 Ashby Ave
- 1516 Blake St
- 1516 Blake St Unit A
- 1525 Tyler St
- 1524 Blake St
- 1612 Parker St
- 3032 Mabel St