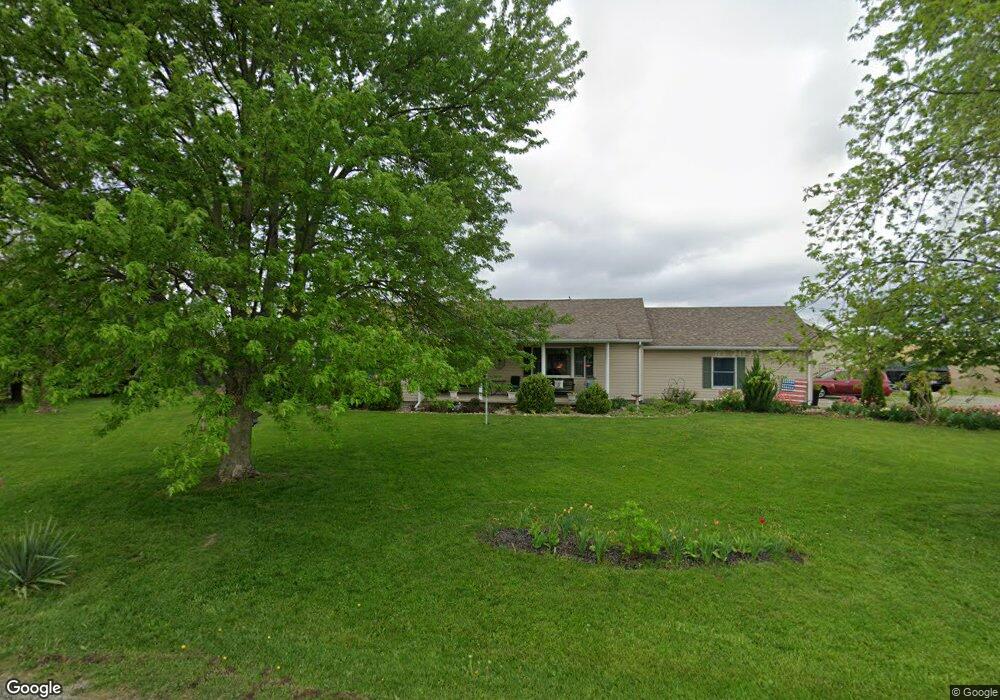
2759 E 800 S Jonesboro, IN 46938
Estimated Value: $215,000 - $328,746
3
Beds
2
Baths
2,088
Sq Ft
$136/Sq Ft
Est. Value
About This Home
This home is located at 2759 E 800 S, Jonesboro, IN 46938 and is currently estimated at $284,937, approximately $136 per square foot. 2759 E 800 S is a home located in Grant County with nearby schools including Madison-Grant Junior/Senior High School and King's Academy.
Ownership History
Date
Name
Owned For
Owner Type
Purchase Details
Closed on
Oct 25, 2006
Sold by
Bach Tinka F
Bought by
Hoke Gregory Kenneth and Hoke Lisa K
Current Estimated Value
Home Financials for this Owner
Home Financials are based on the most recent Mortgage that was taken out on this home.
Original Mortgage
$52,000
Interest Rate
6.38%
Mortgage Type
Purchase Money Mortgage
Create a Home Valuation Report for This Property
The Home Valuation Report is an in-depth analysis detailing your home's value as well as a comparison with similar homes in the area
Purchase History
| Date | Buyer | Sale Price | Title Company |
|---|---|---|---|
| Hoke Gregory Kenneth | -- | None Available |
Source: Public Records
Mortgage History
| Date | Status | Borrower | Loan Amount |
|---|---|---|---|
| Closed | Hoke Gregory Kenneth | $52,000 |
Source: Public Records
Tax History
| Year | Tax Paid | Tax Assessment Tax Assessment Total Assessment is a certain percentage of the fair market value that is determined by local assessors to be the total taxable value of land and additions on the property. | Land | Improvement |
|---|---|---|---|---|
| 2025 | $1,946 | $307,200 | $22,700 | $284,500 |
| 2024 | $1,946 | $282,800 | $22,700 | $260,100 |
| 2023 | $1,953 | $276,300 | $22,700 | $253,600 |
| 2022 | $1,929 | $244,400 | $22,700 | $221,700 |
| 2021 | $1,756 | $206,600 | $20,800 | $185,800 |
| 2020 | $1,521 | $201,000 | $20,800 | $180,200 |
| 2019 | $1,109 | $166,400 | $20,800 | $145,600 |
| 2018 | $1,009 | $161,500 | $17,300 | $144,200 |
| 2017 | $939 | $164,300 | $17,300 | $147,000 |
| 2016 | $772 | $157,100 | $16,400 | $140,700 |
| 2014 | $604 | $149,400 | $16,400 | $133,000 |
| 2013 | $604 | $150,300 | $16,400 | $133,900 |
Source: Public Records
Map
Nearby Homes
Your Personal Tour Guide
Ask me questions while you tour the home.