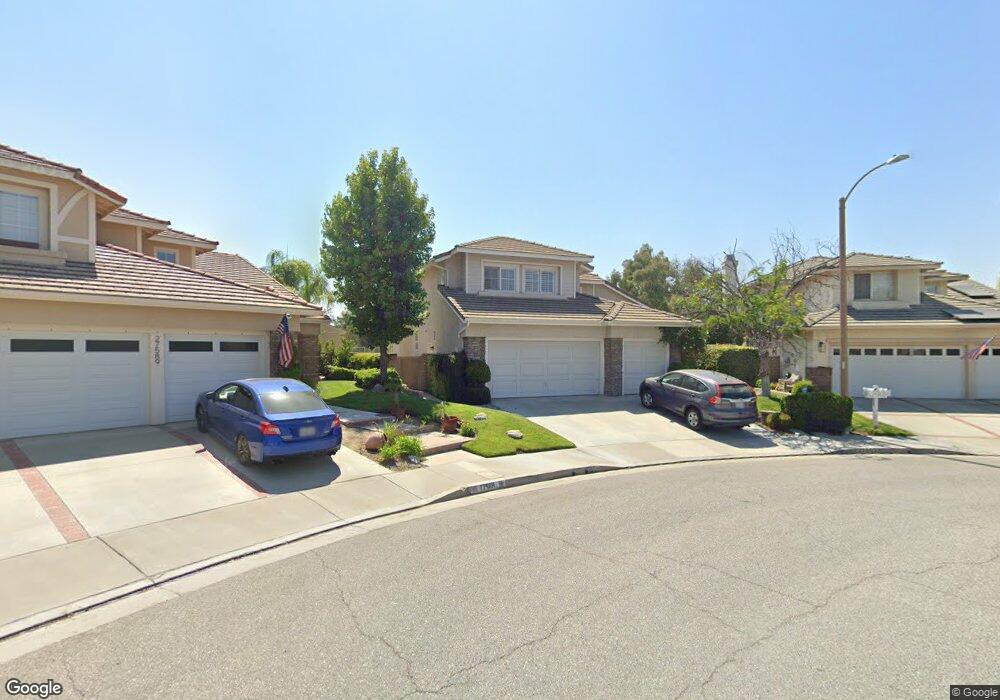
27593 Weston Dr Valencia, CA 91354
Estimated Value: $831,000 - $1,201,000
3
Beds
3
Baths
1,724
Sq Ft
$545/Sq Ft
Est. Value
About This Home
This home is located at 27593 Weston Dr, Valencia, CA 91354 and is currently estimated at $939,221, approximately $544 per square foot. 27593 Weston Dr is a home located in Los Angeles County with nearby schools including Charles Helmers Elementary School, Rio Norte Junior High School, and Valencia High School.
Ownership History
Date
Name
Owned For
Owner Type
Purchase Details
Closed on
Jan 29, 1999
Sold by
Lambert Sean K and Lambert Jackie J
Bought by
Pantellas John A and Pantellas Nancy A
Current Estimated Value
Home Financials for this Owner
Home Financials are based on the most recent Mortgage that was taken out on this home.
Original Mortgage
$260,000
Interest Rate
6.73%
Purchase Details
Closed on
Oct 31, 1995
Sold by
The Newhall Land & Farming Company
Bought by
Epac Northbridge Inc
Home Financials for this Owner
Home Financials are based on the most recent Mortgage that was taken out on this home.
Original Mortgage
$235,550
Interest Rate
7.25%
Purchase Details
Closed on
Oct 23, 1995
Sold by
Epac Northbridge Inc
Bought by
Lambert Sean K and Lambert Jackie J
Home Financials for this Owner
Home Financials are based on the most recent Mortgage that was taken out on this home.
Original Mortgage
$235,550
Interest Rate
7.25%
Create a Home Valuation Report for This Property
The Home Valuation Report is an in-depth analysis detailing your home's value as well as a comparison with similar homes in the area
Home Values in the Area
Average Home Value in this Area
Purchase History
| Date | Buyer | Sale Price | Title Company |
|---|---|---|---|
| Pantellas John A | $325,000 | Investors Title Company | |
| Epac Northbridge Inc | -- | Chicago Title Co | |
| Lambert Sean K | $247,272 | Chicago Title Insurance |
Source: Public Records
Mortgage History
| Date | Status | Borrower | Loan Amount |
|---|---|---|---|
| Previous Owner | Pantellas John A | $260,000 | |
| Previous Owner | Lambert Sean K | $235,550 | |
| Closed | Pantellas John A | $32,500 |
Source: Public Records
Tax History
| Year | Tax Paid | Tax Assessment Tax Assessment Total Assessment is a certain percentage of the fair market value that is determined by local assessors to be the total taxable value of land and additions on the property. | Land | Improvement |
|---|---|---|---|---|
| 2025 | $7,795 | $509,481 | $231,851 | $277,630 |
| 2024 | $7,795 | $499,492 | $227,305 | $272,187 |
| 2023 | $7,582 | $489,699 | $222,849 | $266,850 |
| 2022 | $7,586 | $480,098 | $218,480 | $261,618 |
| 2021 | $7,372 | $470,686 | $214,197 | $256,489 |
| 2019 | $7,057 | $456,728 | $207,845 | $248,883 |
| 2018 | $6,902 | $447,773 | $203,770 | $244,003 |
| 2016 | $6,446 | $430,387 | $195,858 | $234,529 |
| 2015 | $6,232 | $423,924 | $192,917 | $231,007 |
| 2014 | $6,215 | $415,621 | $189,139 | $226,482 |
Source: Public Records
Map
Nearby Homes
- 24322 Camino Oceano
- 24325 Camino Oceano
- 24333 Camino Oceano
- 24435 Camino Oceano
- 24415 Camino Oceano
- 24423 Camino Oceano
- 24408 Camino Oceano
- 24313 Camino Oceano
- 24431 Camino Oceano
- 24427 Camino Oceano
- 24309 Camino Oceano
- 24419 Camino Oceano
- 27605 Harwick Place
- 23344 Timberlane Dr
- 27488 Bridgewater Dr
- 23609 Wilmington Ct
- 23324 Summerglen Place
- 27624 Briarcliff Place
- 23301 Preston Way
- 27573 Berkshire Hills Place
- 27589 Weston Dr
- 27597 Weston Dr
- 27585 Weston Dr
- 27603 Weston Dr
- 24157 Corte Monarca
- 27581 Weston Dr
- 27607 Weston Dr
- 27604 Weston Dr
- 27569 Courtview Dr
- 27577 Weston Dr
- 27608 Weston Dr
- 27611 Weston Dr
- 27568 Courtview Dr
- 27603 Deerfield Ln
- 27573 Weston Dr
- 27614 Weston Dr
- 27636 Yardley Way
- 27626 Yardley Way
- 27617 Weston Dr
- 27640 Yardley Way
Your Personal Tour Guide
Ask me questions while you tour the home.