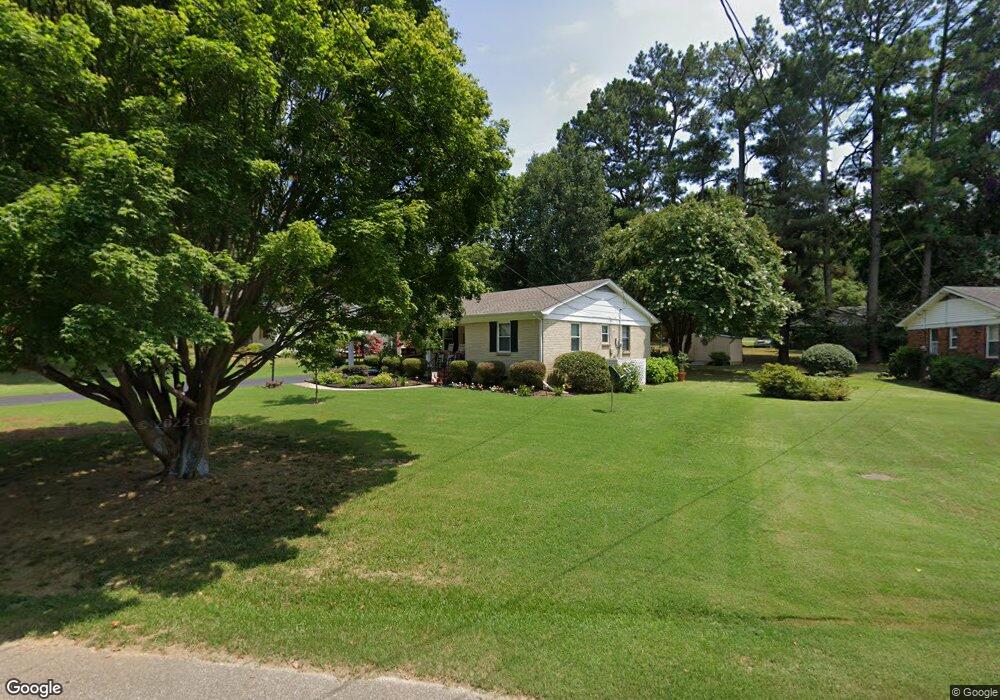
276 Anthony St Ripley, TN 38063
Estimated Value: $127,448 - $166,000
--
Bed
1
Bath
1,026
Sq Ft
$142/Sq Ft
Est. Value
About This Home
This home is located at 276 Anthony St, Ripley, TN 38063 and is currently estimated at $145,862, approximately $142 per square foot. 276 Anthony St is a home located in Lauderdale County with nearby schools including Ripley Primary School, Ripley Elementary School, and Ripley Middle School.
Ownership History
Date
Name
Owned For
Owner Type
Purchase Details
Closed on
Jul 5, 2017
Sold by
Gaines Olivia A
Bought by
Davidson Russell Keith and Davidson Melissia A
Current Estimated Value
Home Financials for this Owner
Home Financials are based on the most recent Mortgage that was taken out on this home.
Original Mortgage
$74,157
Interest Rate
3.89%
Mortgage Type
New Conventional
Purchase Details
Closed on
Jun 3, 2015
Sold by
Danley Jessica
Bought by
Gaines Olivia A
Home Financials for this Owner
Home Financials are based on the most recent Mortgage that was taken out on this home.
Original Mortgage
$73,977
Interest Rate
3.88%
Mortgage Type
New Conventional
Purchase Details
Closed on
Mar 25, 2011
Sold by
Ball Pearl W
Bought by
Danley Jessica
Home Financials for this Owner
Home Financials are based on the most recent Mortgage that was taken out on this home.
Original Mortgage
$74,611
Interest Rate
4.92%
Mortgage Type
Commercial
Purchase Details
Closed on
Mar 4, 1989
Bought by
Ball Pearl W
Purchase Details
Closed on
Jun 13, 1969
Bought by
Hilliard Susie
Create a Home Valuation Report for This Property
The Home Valuation Report is an in-depth analysis detailing your home's value as well as a comparison with similar homes in the area
Home Values in the Area
Average Home Value in this Area
Purchase History
| Date | Buyer | Sale Price | Title Company |
|---|---|---|---|
| Davidson Russell Keith | $72,000 | -- | |
| Gaines Olivia A | $72,500 | -- | |
| Danley Jessica | $72,000 | -- | |
| Ball Pearl W | -- | -- | |
| Hilliard Susie | -- | -- |
Source: Public Records
Mortgage History
| Date | Status | Borrower | Loan Amount |
|---|---|---|---|
| Closed | Davidson Russell Keith | $74,157 | |
| Previous Owner | Gaines Olivia A | $73,977 | |
| Previous Owner | Danley Jessica | $74,611 |
Source: Public Records
Tax History Compared to Growth
Tax History
| Year | Tax Paid | Tax Assessment Tax Assessment Total Assessment is a certain percentage of the fair market value that is determined by local assessors to be the total taxable value of land and additions on the property. | Land | Improvement |
|---|---|---|---|---|
| 2025 | $566 | $23,875 | $0 | $0 |
| 2024 | $566 | $22,275 | $3,000 | $19,275 |
| 2023 | $1,123 | $22,275 | $3,000 | $19,275 |
| 2022 | $1,123 | $22,275 | $3,000 | $19,275 |
| 2021 | $1,075 | $22,275 | $3,000 | $19,275 |
| 2020 | $934 | $22,275 | $3,000 | $19,275 |
| 2019 | $934 | $16,975 | $3,750 | $13,225 |
| 2018 | $934 | $16,975 | $3,750 | $13,225 |
| 2017 | $912 | $16,975 | $3,750 | $13,225 |
| 2016 | $877 | $16,975 | $3,750 | $13,225 |
| 2015 | $847 | $16,975 | $3,750 | $13,225 |
| 2014 | $502 | $17,325 | $3,750 | $13,575 |
Source: Public Records
Map
Nearby Homes
- 115 Westwood Cove
- 103 April Cove
- 242 Lackey Ln
- 122 Willow Creek Dr
- 00 Willow Creek Dr
- 0 Kirkpatrick Dr
- 150 Westwood Cir
- 289 S Washington St
- 224 Kellar Ave
- 334 S Washington St
- 32 U S 51
- 33 U S 51
- 141 Tucker Ave
- 0 Cleveland St
- 0 Monroe St
- LOT 3 U S Highway 51
- LOT 2 U S Highway 51
- 303 Courtney Dr
- 0 Lake Dr Unit 242610
- 215 S Jefferson St
- 274 Anthony St
- 278 Anthony St
- 267 Thompson Ave
- 272 Anthony St
- 265 Thompson Dr
- 129 Thompson Dr
- 261 Thompson Ave
- 119 Thompson Dr
- 270 Anthony St
- 263 Anthony St
- 259 Thompson Ave
- 0 Anthony Church St Unit 3285345
- 0 Anthony Church St Unit 9965974
- 115 Thompson Dr
- 261 Anthony St
- 272 Thompson Ave
- 268 Thompson Ave
- 128 Thompson Dr
- 276 Thompson Ave
- 130 S Alpine St