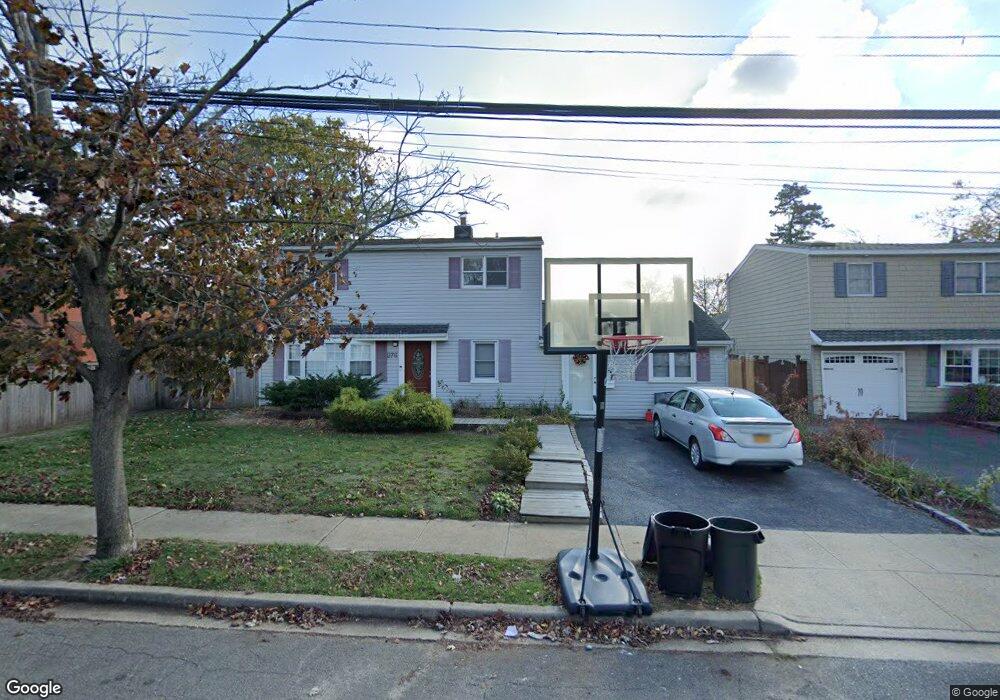
276 Dennis St Oceanside, NY 11572
Estimated Value: $775,000 - $824,415
5
Beds
2
Baths
1,902
Sq Ft
$420/Sq Ft
Est. Value
About This Home
This home is located at 276 Dennis St, Oceanside, NY 11572 and is currently estimated at $799,708, approximately $420 per square foot. 276 Dennis St is a home located in Nassau County with nearby schools including South Oceanside Road Elementary - School 4, Oceanside Middle School, and Oceanside High School.
Ownership History
Date
Name
Owned For
Owner Type
Purchase Details
Closed on
Jun 5, 2015
Sold by
Carlock Margaret and Carlock Walter
Bought by
Rothman Emery Lee and Dapello Luis Alberto
Current Estimated Value
Home Financials for this Owner
Home Financials are based on the most recent Mortgage that was taken out on this home.
Original Mortgage
$392,755
Outstanding Balance
$311,086
Interest Rate
4.4%
Mortgage Type
FHA
Estimated Equity
$488,622
Create a Home Valuation Report for This Property
The Home Valuation Report is an in-depth analysis detailing your home's value as well as a comparison with similar homes in the area
Home Values in the Area
Average Home Value in this Area
Purchase History
| Date | Buyer | Sale Price | Title Company |
|---|---|---|---|
| Rothman Emery Lee | $400,000 | None Available |
Source: Public Records
Mortgage History
| Date | Status | Borrower | Loan Amount |
|---|---|---|---|
| Open | Rothman Emery Lee | $392,755 |
Source: Public Records
Tax History Compared to Growth
Tax History
| Year | Tax Paid | Tax Assessment Tax Assessment Total Assessment is a certain percentage of the fair market value that is determined by local assessors to be the total taxable value of land and additions on the property. | Land | Improvement |
|---|---|---|---|---|
| 2025 | $14,525 | $526 | $212 | $314 |
| 2024 | $4,246 | $526 | $212 | $314 |
| 2023 | $13,610 | $526 | $212 | $314 |
| 2022 | $13,610 | $526 | $212 | $314 |
| 2021 | $18,507 | $508 | $205 | $303 |
| 2020 | $13,448 | $755 | $482 | $273 |
| 2019 | $12,837 | $993 | $634 | $359 |
| 2018 | $15,990 | $982 | $0 | $0 |
| 2017 | $9,588 | $982 | $634 | $348 |
| 2016 | $14,082 | $982 | $634 | $348 |
| 2015 | $4,293 | $982 | $634 | $348 |
| 2014 | $4,293 | $982 | $634 | $348 |
| 2013 | $3,991 | $982 | $634 | $348 |
Source: Public Records
Map
Nearby Homes