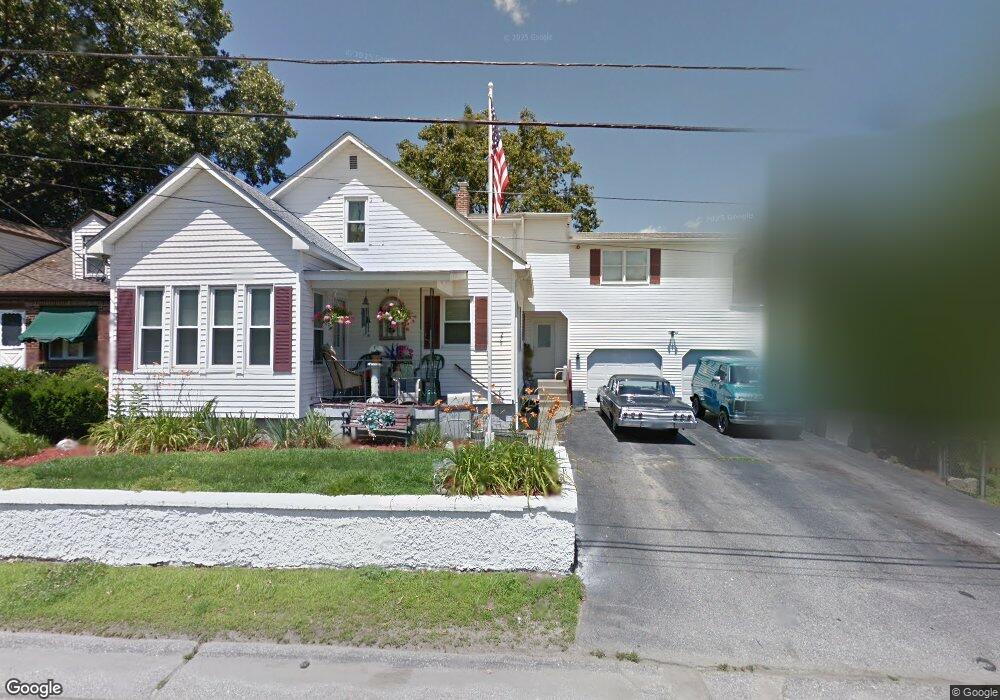
276 Morin St Woonsocket, RI 02895
East Woonsocket NeighborhoodEstimated Value: $382,000 - $518,000
4
Beds
2
Baths
2,098
Sq Ft
$218/Sq Ft
Est. Value
About This Home
This home is located at 276 Morin St, Woonsocket, RI 02895 and is currently estimated at $458,234, approximately $218 per square foot. 276 Morin St is a home located in Providence County with nearby schools including Woonsocket High School, Rise Prep Mayoral Academy Middle School, and Rise Prep Mayoral Academy.
Ownership History
Date
Name
Owned For
Owner Type
Purchase Details
Closed on
Aug 3, 2000
Sold by
Unibank Savings
Bought by
Beauchemin Edward
Current Estimated Value
Purchase Details
Closed on
Feb 18, 1992
Sold by
Cote Laval R
Bought by
Pham Binh Cong
Home Financials for this Owner
Home Financials are based on the most recent Mortgage that was taken out on this home.
Original Mortgage
$90,000
Interest Rate
8.18%
Mortgage Type
Purchase Money Mortgage
Create a Home Valuation Report for This Property
The Home Valuation Report is an in-depth analysis detailing your home's value as well as a comparison with similar homes in the area
Home Values in the Area
Average Home Value in this Area
Purchase History
| Date | Buyer | Sale Price | Title Company |
|---|---|---|---|
| Beauchemin Edward | $84,000 | -- | |
| Beauchemin Edward | $84,000 | -- | |
| Pham Binh Cong | $110,000 | -- |
Source: Public Records
Mortgage History
| Date | Status | Borrower | Loan Amount |
|---|---|---|---|
| Open | Pham Binh Cong | $17,850 | |
| Open | Pham Binh Cong | $166,000 | |
| Closed | Pham Binh Cong | $140,000 | |
| Previous Owner | Pham Binh Cong | $90,000 |
Source: Public Records
Tax History
| Year | Tax Paid | Tax Assessment Tax Assessment Total Assessment is a certain percentage of the fair market value that is determined by local assessors to be the total taxable value of land and additions on the property. | Land | Improvement |
|---|---|---|---|---|
| 2025 | $4,946 | $440,400 | $104,800 | $335,600 |
| 2024 | $4,634 | $318,700 | $85,600 | $233,100 |
| 2023 | $4,455 | $318,700 | $85,600 | $233,100 |
| 2022 | $4,455 | $318,700 | $85,600 | $233,100 |
| 2021 | $4,546 | $191,400 | $66,500 | $124,900 |
| 2020 | $4,594 | $191,400 | $66,500 | $124,900 |
| 2018 | $4,609 | $191,400 | $66,500 | $124,900 |
| 2017 | $5,514 | $183,200 | $63,500 | $119,700 |
| 2016 | $5,833 | $183,200 | $63,500 | $119,700 |
| 2015 | $6,701 | $183,200 | $63,500 | $119,700 |
| 2014 | $4,466 | $177,500 | $69,800 | $107,700 |
Source: Public Records
Map
Nearby Homes
- 95 Mitris Blvd
- 202 Paine St
- 727 Mendon Rd
- 194 Paine St
- 212 Saint Louis Ave
- 188 Saint Louis Ave
- 178 Saint Louis Ave
- 110 Saint Leon Ave
- 23 Rutland St
- 82 Paine St
- 68 Kenwood St
- 568 Elm St
- 34 Heroux Ave
- Lot 2 Pulaski Blvd
- 21 Irving St
- 96 Mill St Unit 303
- 56 Mailloux St
- 311 Elm St
- 375 Congress St
- 271 Elm St
Your Personal Tour Guide
Ask me questions while you tour the home.