Estimated Value: $484,000 - $634,000
5
Beds
3
Baths
3,274
Sq Ft
$177/Sq Ft
Est. Value
About This Home
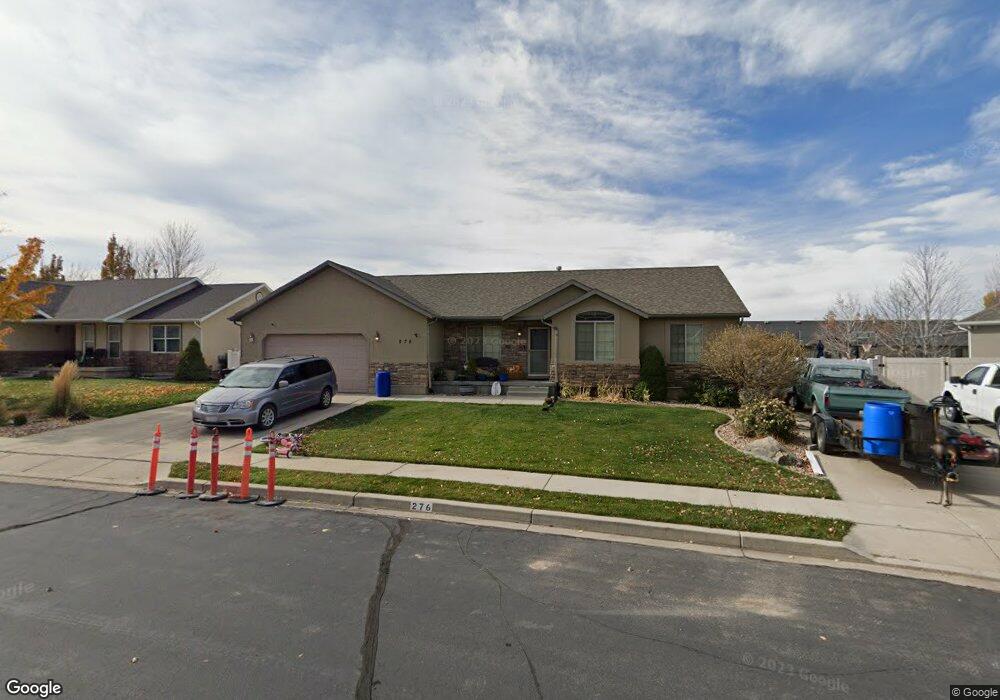
This home is located at 276 S 860 E Unit 52, Salem, UT 84653 and is currently estimated at $580,882, approximately $177 per square foot. 276 S 860 E Unit 52 is a home located in Utah County with nearby schools including Foothills Elementary School, Valley View Middle School, and Salem Junior High School.
Ownership History
Date
Name
Owned For
Owner Type
Purchase Details
Closed on
Aug 3, 2017
Sold by
Suell Quinn
Bought by
Richards Brandon
Current Estimated Value
Home Financials for this Owner
Home Financials are based on the most recent Mortgage that was taken out on this home.
Original Mortgage
$232,924
Outstanding Balance
$194,042
Interest Rate
3.9%
Estimated Equity
$386,840
Purchase Details
Closed on
Feb 19, 2013
Sold by
Snell Kristin
Bought by
Snell Quinn
Purchase Details
Closed on
Aug 17, 2007
Sold by
Wallace Jolene and Wallace Daniel R
Bought by
Snell Quinn and Snell Kristin
Purchase Details
Closed on
Nov 4, 2004
Sold by
Robert Nelson Construction Llc
Bought by
Hakes Dallas
Create a Home Valuation Report for This Property
The Home Valuation Report is an in-depth analysis detailing your home's value as well as a comparison with similar homes in the area
Home Values in the Area
Average Home Value in this Area
Purchase History
| Date | Buyer | Sale Price | Title Company |
|---|---|---|---|
| Richards Brandon | -- | Wasatch Land & Title | |
| Snell Quinn | -- | None Available | |
| Snell Quinn | -- | Gt Title Services Spanish | |
| Hakes Dallas | -- | Pro Title & Escrow Inc |
Source: Public Records
Mortgage History
| Date | Status | Borrower | Loan Amount |
|---|---|---|---|
| Open | Richards Brandon | $232,924 |
Source: Public Records
Tax History
| Year | Tax Paid | Tax Assessment Tax Assessment Total Assessment is a certain percentage of the fair market value that is determined by local assessors to be the total taxable value of land and additions on the property. | Land | Improvement |
|---|---|---|---|---|
| 2025 | $2,832 | $315,480 | -- | -- |
| 2024 | $2,832 | $287,210 | $0 | $0 |
| 2023 | $2,859 | $290,455 | $0 | $0 |
| 2022 | $3,015 | $301,620 | $0 | $0 |
| 2021 | $2,360 | $378,800 | $122,100 | $256,700 |
| 2020 | $2,322 | $362,700 | $111,000 | $251,700 |
| 2019 | $2,135 | $340,500 | $102,500 | $238,000 |
| 2018 | $2,148 | $327,400 | $102,500 | $224,900 |
| 2017 | $2,110 | $171,545 | $0 | $0 |
| 2016 | $2,096 | $168,410 | $0 | $0 |
| 2015 | $2,085 | $164,560 | $0 | $0 |
| 2014 | $1,714 | $135,520 | $0 | $0 |
Source: Public Records
Map
Nearby Homes
- 1003 E 310 S Unit 11
- 1001 E 250 S
- 88 S 850 E
- 1026 E 310 S
- 1018 E 250 S
- 1036 E 310 S
- 1034 E 250 S
- 1033 E 250 S
- 6 Shady Ln
- 173 E 10000 S
- 9800 Woodland Hills Dr
- 180 Woodland Hills Dr
- 84 N 500 E
- 1939 E Dorset Way Unit 306
- 1965 E Dorset Way Unit 303
- 1558 E 1010 N Unit 203
- 1984 E Dorset Way Unit 279
- 1802 E Albion Dr Unit 1142
- 1962 E Dorset Way Unit 276
- 1968 E Dorset Way Unit 277
Your Personal Tour Guide
Ask me questions while you tour the home.