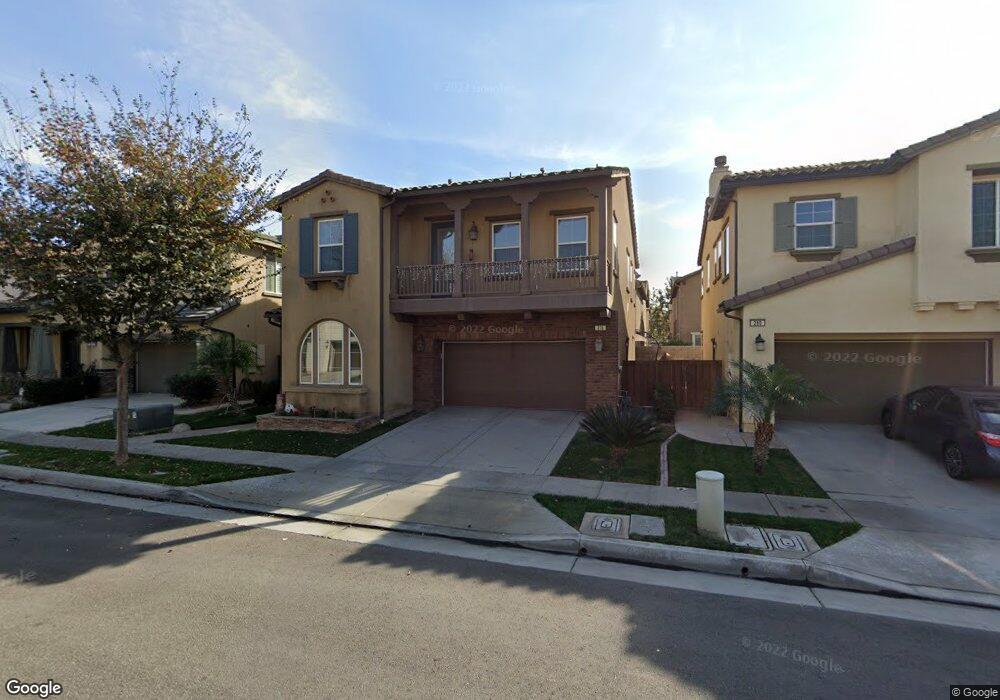
276 W Tulip Tree Ave Orange, CA 92865
Estimated Value: $1,104,757 - $1,183,000
3
Beds
3
Baths
2,084
Sq Ft
$548/Sq Ft
Est. Value
About This Home
This home is located at 276 W Tulip Tree Ave, Orange, CA 92865 and is currently estimated at $1,142,439, approximately $548 per square foot. 276 W Tulip Tree Ave is a home located in Orange County with nearby schools including Fletcher Mandarin Language & Gate Academy, Cerro Villa Middle School, and Villa Park High School.
Ownership History
Date
Name
Owned For
Owner Type
Purchase Details
Closed on
Jun 3, 2011
Sold by
Cardoso Ligia
Bought by
Nicholson Richard and Van Hamersveld Monique
Current Estimated Value
Home Financials for this Owner
Home Financials are based on the most recent Mortgage that was taken out on this home.
Original Mortgage
$343,200
Interest Rate
4.46%
Mortgage Type
New Conventional
Purchase Details
Closed on
Nov 6, 2006
Sold by
Lennar Homes Of California Inc
Bought by
Cardoso Ligia Tabon
Home Financials for this Owner
Home Financials are based on the most recent Mortgage that was taken out on this home.
Original Mortgage
$175,000
Interest Rate
6.32%
Mortgage Type
Stand Alone Second
Purchase Details
Closed on
Sep 25, 2006
Sold by
Cardoso Francisco
Bought by
Cardoso Ligia
Home Financials for this Owner
Home Financials are based on the most recent Mortgage that was taken out on this home.
Original Mortgage
$175,000
Interest Rate
6.32%
Mortgage Type
Stand Alone Second
Create a Home Valuation Report for This Property
The Home Valuation Report is an in-depth analysis detailing your home's value as well as a comparison with similar homes in the area
Home Values in the Area
Average Home Value in this Area
Purchase History
| Date | Buyer | Sale Price | Title Company |
|---|---|---|---|
| Nicholson Richard | $429,000 | California Title Company | |
| Cardoso Ligia Tabon | $825,000 | North American Title Co | |
| Cardoso Ligia | -- | North American Title |
Source: Public Records
Mortgage History
| Date | Status | Borrower | Loan Amount |
|---|---|---|---|
| Previous Owner | Nicholson Richard | $343,200 | |
| Previous Owner | Cardoso Ligia Tabon | $175,000 | |
| Previous Owner | Cardoso Ligia | $650,000 |
Source: Public Records
Tax History Compared to Growth
Tax History
| Year | Tax Paid | Tax Assessment Tax Assessment Total Assessment is a certain percentage of the fair market value that is determined by local assessors to be the total taxable value of land and additions on the property. | Land | Improvement |
|---|---|---|---|---|
| 2025 | $10,035 | $538,842 | $156,907 | $381,935 |
| 2024 | $10,035 | $528,277 | $153,830 | $374,447 |
| 2023 | $9,847 | $517,919 | $150,814 | $367,105 |
| 2022 | $9,664 | $507,764 | $147,857 | $359,907 |
| 2021 | $9,426 | $497,808 | $144,958 | $352,850 |
| 2020 | $9,298 | $492,704 | $143,472 | $349,232 |
| 2019 | $9,163 | $483,044 | $140,659 | $342,385 |
| 2018 | $9,013 | $473,573 | $137,901 | $335,672 |
| 2017 | $8,689 | $464,288 | $135,197 | $329,091 |
| 2016 | $8,518 | $455,185 | $132,546 | $322,639 |
| 2015 | $8,380 | $448,348 | $130,555 | $317,793 |
| 2014 | $8,778 | $439,566 | $127,998 | $311,568 |
Source: Public Records
Map
Nearby Homes
- 356 W Mountain Holly Ave
- 3052 N Spicewood St
- 116 W Cork Tree Dr
- 3115 N Sunrise Ct
- 2880 N Glassell St
- 2890 N Glassell St
- 317 E Meadowbrook Ave
- 349 E Meadowbrook Ave
- 404 E Meadowbrook Ave
- 369 N Via Remo
- 2701 N Glenside St
- 386 N Via Porto
- 3010 E Via Taranto
- 438 N Via Capri
- 3002 N Pinewood St
- 320 N Park Vista St Unit 64
- 320 N Park Vista St Unit 109
- 320 N Park Vista St Unit 149
- 320 N Park Vista St Unit 180
- 320 N Park Vista St Unit 28
- 280 W Tulip Tree Ave
- 268 W Tulip Tree Ave
- 271 W Pebble Creek Ln
- 273 W Pebble Creek Ln Unit 2
- 273 W Pebble Creek Ln Unit 8
- 285 W Pebble Creek Ln Unit 5
- 256 W Tulip Tree Ave
- 286 W Tulip Tree Ave
- 269 W Pebble Creek Ln
- 287 W Pebble Creek Ln Unit 4
- 271 W Tulip Tree Ave
- 265 W Tulip Tree Ave
- 289 W Pebble Creek Ln
- 267 W Pebble Creek Ln
- 277 W Pebble Creek Ln
- 290 W Tulip Tree Ave
- 283 W Tulip Tree Ave
- 281 W Pebble Creek Ln
- 255 W Pebble Creek Ln
- 291 W Pebble Creek Ln Unit 2