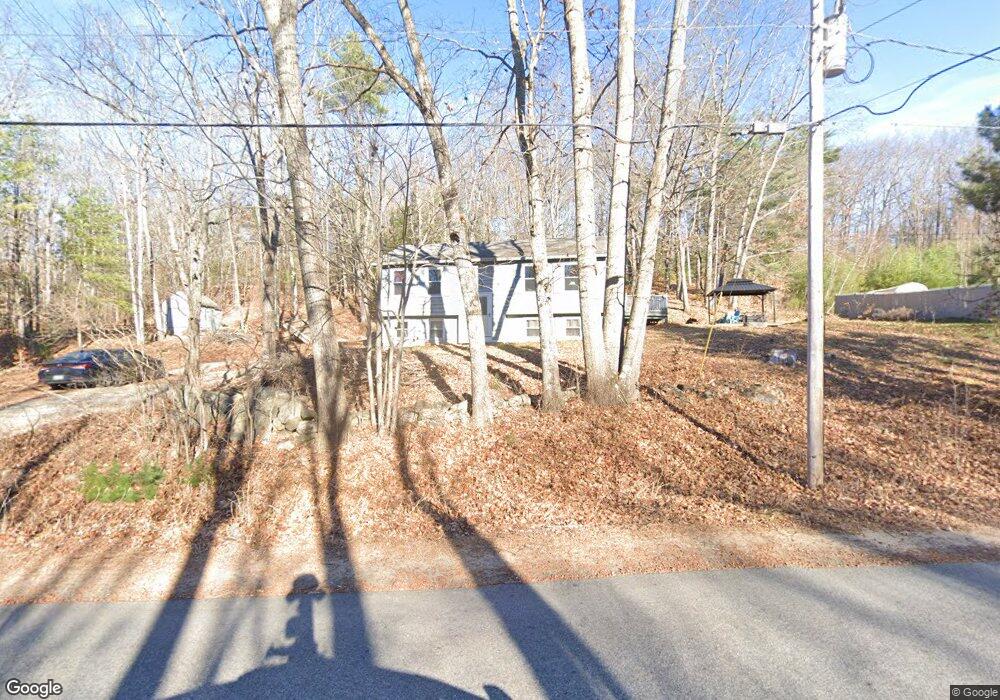
276 Wiley Rd Naples, ME 04055
Estimated Value: $285,849 - $381,000
3
Beds
1
Bath
1,150
Sq Ft
$289/Sq Ft
Est. Value
About This Home
This home is located at 276 Wiley Rd, Naples, ME 04055 and is currently estimated at $331,962, approximately $288 per square foot. 276 Wiley Rd is a home located in Cumberland County with nearby schools including Lake Region High School.
Ownership History
Date
Name
Owned For
Owner Type
Purchase Details
Closed on
Jun 12, 2020
Sold by
Davenport Shawn M
Bought by
Davenport Shawn M and Thompson Courtney D
Current Estimated Value
Home Financials for this Owner
Home Financials are based on the most recent Mortgage that was taken out on this home.
Original Mortgage
$148,000
Interest Rate
3.2%
Mortgage Type
New Conventional
Purchase Details
Closed on
Oct 1, 2007
Sold by
Julien Joseph J
Bought by
Davenport Shawn M
Home Financials for this Owner
Home Financials are based on the most recent Mortgage that was taken out on this home.
Original Mortgage
$158,162
Interest Rate
6.65%
Mortgage Type
FHA
Create a Home Valuation Report for This Property
The Home Valuation Report is an in-depth analysis detailing your home's value as well as a comparison with similar homes in the area
Home Values in the Area
Average Home Value in this Area
Purchase History
| Date | Buyer | Sale Price | Title Company |
|---|---|---|---|
| Davenport Shawn M | -- | None Available | |
| Davenport Shawn M | -- | None Available | |
| Davenport Shawn M | -- | -- | |
| Davenport Shawn M | -- | -- |
Source: Public Records
Mortgage History
| Date | Status | Borrower | Loan Amount |
|---|---|---|---|
| Closed | Davenport Shawn M | $148,000 | |
| Closed | Davenport Shawn M | $181,507 | |
| Closed | Davenport Shawn M | $178,825 | |
| Closed | Davenport Shawn M | $158,162 |
Source: Public Records
Tax History
| Year | Tax Paid | Tax Assessment Tax Assessment Total Assessment is a certain percentage of the fair market value that is determined by local assessors to be the total taxable value of land and additions on the property. | Land | Improvement |
|---|---|---|---|---|
| 2025 | $1,568 | $165,031 | $57,373 | $107,658 |
| 2024 | $1,535 | $165,031 | $57,373 | $107,658 |
| 2023 | $1,510 | $165,031 | $57,373 | $107,658 |
| 2022 | $1,362 | $165,031 | $57,373 | $107,658 |
| 2021 | $1,612 | $120,785 | $41,462 | $79,323 |
| 2020 | $1,612 | $120,785 | $41,462 | $79,323 |
| 2019 | $1,612 | $120,785 | $41,462 | $79,323 |
| 2018 | $1,612 | $120,785 | $41,462 | $79,323 |
| 2017 | $1,612 | $120,785 | $41,462 | $79,323 |
| 2016 | $1,594 | $120,785 | $41,462 | $79,323 |
| 2015 | $1,637 | $120,785 | $41,462 | $79,323 |
| 2014 | $1,637 | $120,785 | $41,462 | $79,323 |
Source: Public Records
Map
Nearby Homes
- 60 Turcotte Dr
- 15 Monroe Dr
- 414 Harrison Rd
- 90 Lewis Rd
- 492 Lewis Rd
- 21 Daffodil Ct Unit 16
- 83 Hydrangea Cir Unit 11
- 1396 Poland Spring Rd
- 56 Hydrangea Cir Unit 10
- 33 Knight Dr
- 5 Tenney Hill Rd
- 15 Goodridge Dr Unit 15
- 23 Clifford Rd Unit 17
- 254 Fogg Rd
- 65 Tenney Hill Rd
- 679 Roosevelt Trail
- 1277 Naples Rd
- 1278 Naples Rd
- 24 Dragon Back Rd
- 29 Winsor Green Rd Unit 29
- 292 Wiley Rd
- Lot 8 Wiley Rd
- 264 Wiley Rd
- 20 Sams Bluff
- 298 Wiley Rd
- 315 Wiley Rd
- Lot 3 Wiley Rd
- 0 Wiley Rd Unit 597473
- 0 Wiley Rd Unit 315893
- 0 Wiley Rd Unit 304362
- 0 Wiley Rd Unit 244196
- 0 Wiley Rd Unit 237620
- 0 Wiley Rd Unit 311460
- 0 Wiley Rd Unit 549087
- 0 Wiley Rd Unit 510139
- 0 Wiley Rd Unit 504025
- 0 Wiley Rd Unit 502699
- 0 Wiley Rd Unit 502687
- 0 Wiley Rd Unit 493385
- 0 Wiley Rd Unit 178599
Your Personal Tour Guide
Ask me questions while you tour the home.