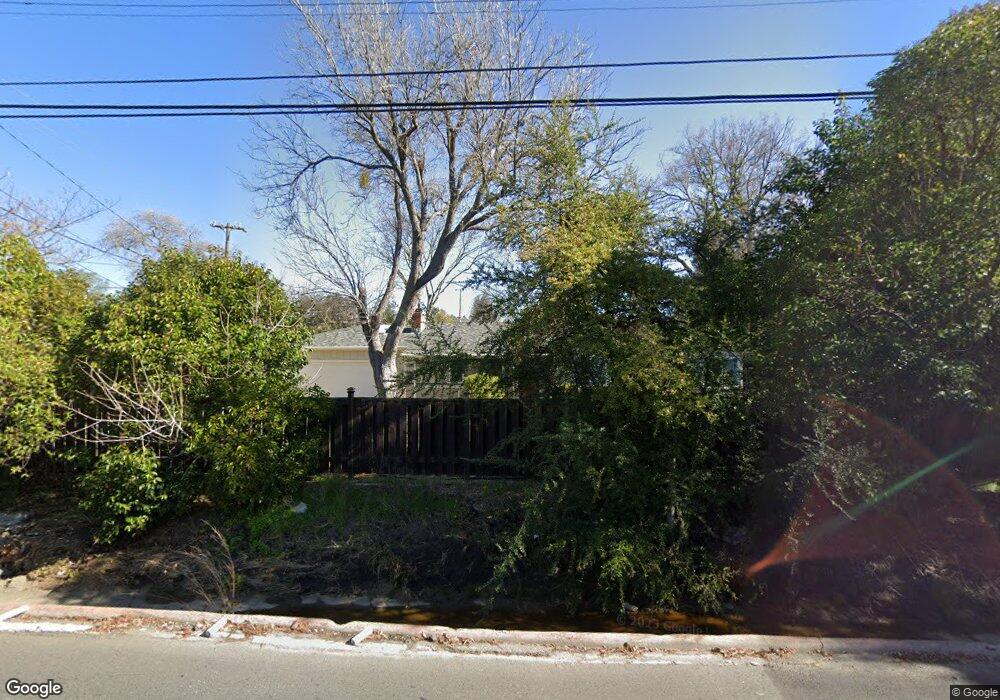
2760 Walnut Blvd Walnut Creek, CA 94596
Howe Homestead NeighborhoodEstimated Value: $1,018,000 - $1,127,898
3
Beds
1
Bath
1,111
Sq Ft
$959/Sq Ft
Est. Value
About This Home
This home is located at 2760 Walnut Blvd, Walnut Creek, CA 94596 and is currently estimated at $1,065,975, approximately $959 per square foot. 2760 Walnut Blvd is a home located in Contra Costa County with nearby schools including Indian Valley Elementary School, Walnut Creek Intermediate School, and Las Lomas High School.
Ownership History
Date
Name
Owned For
Owner Type
Purchase Details
Closed on
Dec 15, 2021
Sold by
Leung Fai Tony Hui
Bought by
Chen Ling
Current Estimated Value
Purchase Details
Closed on
Dec 29, 2020
Sold by
Leung Fai Tony Hui and Chen Ling
Bought by
Leung Fai Tony Hui and Chen Ling
Home Financials for this Owner
Home Financials are based on the most recent Mortgage that was taken out on this home.
Original Mortgage
$631,000
Interest Rate
2.7%
Mortgage Type
New Conventional
Purchase Details
Closed on
Jul 21, 2015
Sold by
Leung Fai Tony Hiu and Chen Ling
Bought by
Leung Chen Family Trust
Purchase Details
Closed on
Dec 19, 2014
Sold by
Leung Fai Tony Hiu and Chen Ling
Bought by
Leung Fai Tony Hiu and Chen Ling
Home Financials for this Owner
Home Financials are based on the most recent Mortgage that was taken out on this home.
Original Mortgage
$414,000
Interest Rate
3.96%
Mortgage Type
New Conventional
Purchase Details
Closed on
Sep 3, 2013
Sold by
Inhome Llc
Bought by
Leung Tony and Chen Ling
Home Financials for this Owner
Home Financials are based on the most recent Mortgage that was taken out on this home.
Original Mortgage
$365,000
Interest Rate
4.36%
Mortgage Type
New Conventional
Purchase Details
Closed on
Sep 21, 2012
Sold by
Inhome Llc
Bought by
Inhome Llc
Home Financials for this Owner
Home Financials are based on the most recent Mortgage that was taken out on this home.
Original Mortgage
$253,500
Interest Rate
3.63%
Mortgage Type
New Conventional
Purchase Details
Closed on
Jul 24, 2012
Sold by
Principle Capital Llc
Bought by
Inhome Llc
Home Financials for this Owner
Home Financials are based on the most recent Mortgage that was taken out on this home.
Original Mortgage
$253,500
Interest Rate
3.63%
Mortgage Type
New Conventional
Purchase Details
Closed on
May 21, 2012
Sold by
Chung Alfred
Bought by
Principle Capital Llc
Home Financials for this Owner
Home Financials are based on the most recent Mortgage that was taken out on this home.
Original Mortgage
$145,000
Interest Rate
3.85%
Mortgage Type
New Conventional
Purchase Details
Closed on
May 2, 2012
Sold by
Oatey Douglas M
Bought by
Chung Alfred
Home Financials for this Owner
Home Financials are based on the most recent Mortgage that was taken out on this home.
Original Mortgage
$145,000
Interest Rate
3.85%
Mortgage Type
New Conventional
Create a Home Valuation Report for This Property
The Home Valuation Report is an in-depth analysis detailing your home's value as well as a comparison with similar homes in the area
Home Values in the Area
Average Home Value in this Area
Purchase History
| Date | Buyer | Sale Price | Title Company |
|---|---|---|---|
| Chen Ling | -- | Law Offices Of Bresler & Lee | |
| Leung Fai Tony Hui | -- | Law Offices Of Bresler & Lee | |
| Leung Fai Tony Hui | -- | Chicago Title Company | |
| Leung Fai Tony Hui | -- | Chicago Title Company | |
| Leung Chen Family Trust | -- | None Available | |
| Leung Fai Tony Hiu | -- | Old Republic Title Company | |
| Leung Tony | $305,000 | Chicago Title Company | |
| Inhome Llc | -- | Old Republic Title Company | |
| Inhome Llc | -- | Old Republic Title Company | |
| Principle Capital Llc | $290,000 | North American Title Company | |
| Chung Alfred | -- | North American Title Company | |
| Chung Alfred | $290,000 | None Available |
Source: Public Records
Mortgage History
| Date | Status | Borrower | Loan Amount |
|---|---|---|---|
| Previous Owner | Leung Fai Tony Hui | $631,000 | |
| Previous Owner | Leung Fai Tony Hiu | $414,000 | |
| Previous Owner | Leung Tony | $365,000 | |
| Previous Owner | Inhome Llc | $253,500 | |
| Previous Owner | Inhome Llc | $145,000 | |
| Previous Owner | Principle Capital Llc | $145,000 |
Source: Public Records
Tax History Compared to Growth
Tax History
| Year | Tax Paid | Tax Assessment Tax Assessment Total Assessment is a certain percentage of the fair market value that is determined by local assessors to be the total taxable value of land and additions on the property. | Land | Improvement |
|---|---|---|---|---|
| 2025 | $8,157 | $646,488 | $467,936 | $178,552 |
| 2024 | $7,963 | $633,812 | $458,761 | $175,051 |
| 2023 | $7,963 | $621,385 | $449,766 | $171,619 |
| 2022 | $7,720 | $609,202 | $440,948 | $168,254 |
| 2021 | $7,510 | $597,257 | $432,302 | $164,955 |
| 2019 | $7,340 | $579,544 | $419,481 | $160,063 |
| 2018 | $7,093 | $568,181 | $411,256 | $156,925 |
| 2017 | $6,955 | $557,042 | $403,193 | $153,849 |
| 2016 | $6,817 | $546,121 | $395,288 | $150,833 |
| 2015 | $6,657 | $537,919 | $389,351 | $148,568 |
| 2014 | $6,649 | $527,383 | $381,725 | $145,658 |
Source: Public Records
Map
Nearby Homes
- 251 Haleena Place
- 135 Cara Ct
- 175 Sierra Dr Unit 309
- 150 Sharene Ln Unit 108
- 150 Sharene Ln Unit 104
- 150 Sharene Ln Unit 111
- 1236 Walker Ave Unit 101
- 185 Sierra Dr Unit 314
- 2560 Walnut Blvd Unit 3
- 2562 Walnut Blvd Unit 66
- 1241 Homestead Ave Unit 206
- 1680 San Miguel Dr
- 1640 San Miguel Dr
- 1696 San Miguel Dr Unit F9
- 61 Alberta Terrace
- 1743 Carmel Dr Unit 9
- 1611 Carmel Dr
- 1282 Carmel Ct
- 1201 Alta Vista Dr Unit 209
- 245 Lakewood Rd