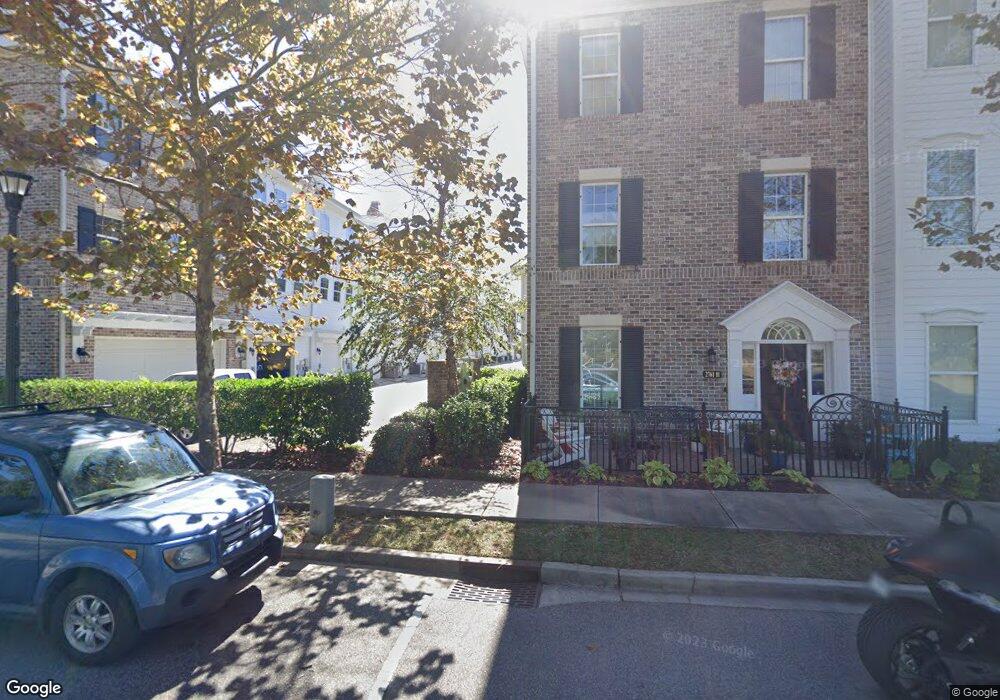
2761 Kruzel St Myrtle Beach, SC 29577
Market Commons NeighborhoodEstimated Value: $357,000 - $402,000
2
Beds
4
Baths
1,660
Sq Ft
$228/Sq Ft
Est. Value
About This Home
This home is located at 2761 Kruzel St, Myrtle Beach, SC 29577 and is currently estimated at $378,656, approximately $228 per square foot. 2761 Kruzel St is a home located in Horry County with nearby schools including Myrtle Beach Child Development Center, Myrtle Beach Primary School, and Myrtle Beach Elementary School.
Ownership History
Date
Name
Owned For
Owner Type
Purchase Details
Closed on
Jul 15, 2021
Sold by
Trimble Quaye R
Bought by
Felder Watson E
Current Estimated Value
Home Financials for this Owner
Home Financials are based on the most recent Mortgage that was taken out on this home.
Original Mortgage
$258,236
Outstanding Balance
$234,309
Interest Rate
2.9%
Mortgage Type
FHA
Estimated Equity
$144,347
Purchase Details
Closed on
Mar 18, 2015
Sold by
Bahn Lyndsay C and Trimble Quaye R
Bought by
Trimble Quaye R
Purchase Details
Closed on
Dec 6, 2007
Sold by
Market Common Townhomes Inc
Bought by
Bahn Lyndsay C and Trimble Quaye R
Home Financials for this Owner
Home Financials are based on the most recent Mortgage that was taken out on this home.
Original Mortgage
$25,500
Interest Rate
6.22%
Mortgage Type
Credit Line Revolving
Purchase Details
Closed on
May 16, 2007
Sold by
Luk Mb2 Llc
Bought by
Market Commons Townhomes Inc
Create a Home Valuation Report for This Property
The Home Valuation Report is an in-depth analysis detailing your home's value as well as a comparison with similar homes in the area
Home Values in the Area
Average Home Value in this Area
Purchase History
| Date | Buyer | Sale Price | Title Company |
|---|---|---|---|
| Felder Watson E | $263,000 | -- | |
| Trimble Quaye R | -- | -- | |
| Bahn Lyndsay C | $255,000 | Attorney | |
| Market Commons Townhomes Inc | $640,000 | None Available |
Source: Public Records
Mortgage History
| Date | Status | Borrower | Loan Amount |
|---|---|---|---|
| Open | Felder Watson E | $258,236 | |
| Previous Owner | Bahn Lyndsay C | $25,500 |
Source: Public Records
Tax History Compared to Growth
Tax History
| Year | Tax Paid | Tax Assessment Tax Assessment Total Assessment is a certain percentage of the fair market value that is determined by local assessors to be the total taxable value of land and additions on the property. | Land | Improvement |
|---|---|---|---|---|
| 2024 | $4,990 | $15,214 | $5,000 | $10,214 |
| 2023 | $4,990 | $13,606 | $2,761 | $10,845 |
| 2021 | $4,607 | $10,744 | $2,160 | $8,584 |
| 2020 | $3,507 | $16,116 | $3,240 | $12,876 |
| 2019 | $3,507 | $16,116 | $3,240 | $12,876 |
| 2018 | $3,147 | $11,832 | $2,400 | $9,432 |
| 2017 | $603 | $7,888 | $1,600 | $6,288 |
| 2016 | -- | $7,888 | $1,600 | $6,288 |
| 2015 | $597 | $7,888 | $1,600 | $6,288 |
| 2014 | $538 | $7,888 | $1,600 | $6,288 |
Source: Public Records
Map
Nearby Homes
- 1411 Peterson St
- 830 Howard Ave Unit D
- 861 Murray Ave
- 750 Howard Ave Unit D
- 750 Howard Ave Unit E
- 2790 Howard Ave Unit D
- 763 Moen Place Unit 763-B
- 852 Iris St Unit D
- 962 Hendrick Ave
- 853 Johnson Ave
- 524 Farrow Pkwy
- 1188 Peterson St
- 736 Satterwhite Way
- 3429 Thrash Way
- 780 Gabreski Ln Unit A-2
- 3452 Baldwin Ln
- 804 Shine Ave
- 750 Shine Ave Unit 750
- 945 Rosencrans Ln Unit B
- 3506 Evergreen Way
- 2761 Kruzel St Unit C
- 2761 Kruzel St Unit E
- 2761 Kruzel St Unit Market Common
- 2761 Kruzel St Unit 2761-C Kruzel St.
- 2761 Kruzel St Unit Drayton
- 2761 Kruzel St Unit E
- 2761 Kruzel St
- 2761 Kruzel St
- 2761 Kruzel St
- 2761 Kruzel St
- 2761 Kruzel St
- 2761 Kruzel St
- 2761 Kruzel St
- 2761 Kruzel St Unit A
- 2761 Kruzel St Unit A
- 2761B Kruzel St Unit B
- 2761 Kruzel St Unit D
- 2761B Kruzel St Unit Drayton 2
- 2761B Kruzel St
- 2761C Kruzel St Unit 2761C Pinckney Squar