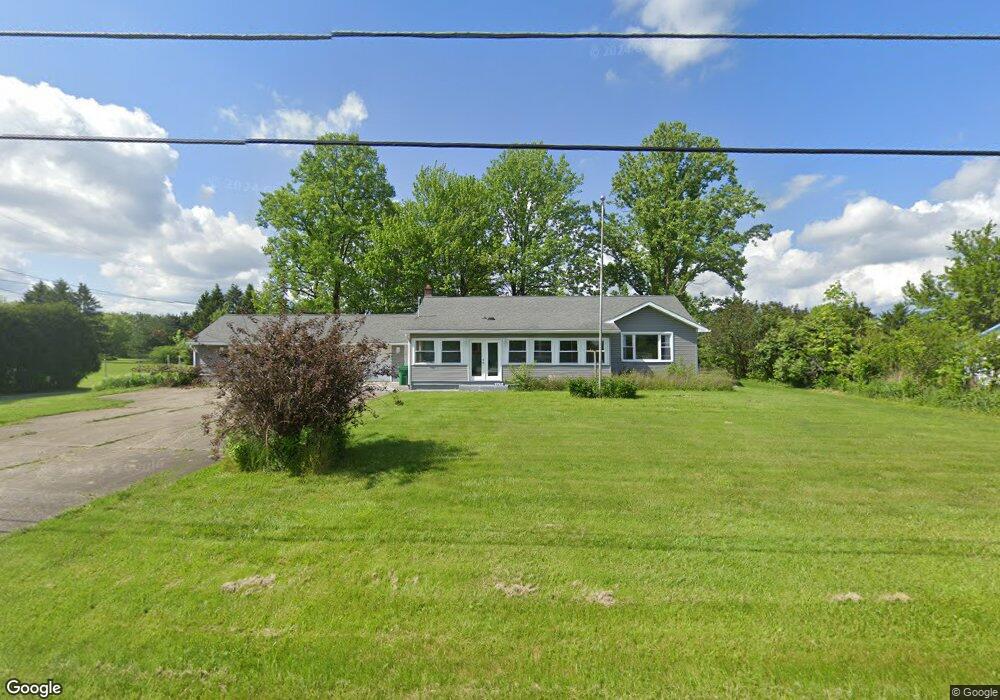
2762 E South Range Rd New Springfield, OH 44443
Estimated Value: $169,461 - $222,000
3
Beds
1
Bath
1,317
Sq Ft
$148/Sq Ft
Est. Value
About This Home
This home is located at 2762 E South Range Rd, New Springfield, OH 44443 and is currently estimated at $195,365, approximately $148 per square foot. 2762 E South Range Rd is a home located in Mahoning County with nearby schools including Springfield Elementary School, Springfield Intermediate Middle School, and Springfield High School.
Ownership History
Date
Name
Owned For
Owner Type
Purchase Details
Closed on
Feb 21, 2020
Sold by
Baran Edward T and Tatar Janina Marie
Bought by
Smith Nora A and Smith Duane E
Current Estimated Value
Home Financials for this Owner
Home Financials are based on the most recent Mortgage that was taken out on this home.
Original Mortgage
$71,200
Outstanding Balance
$62,502
Interest Rate
3.6%
Mortgage Type
New Conventional
Estimated Equity
$132,863
Purchase Details
Closed on
Jul 18, 2019
Bought by
Baran Edward T
Purchase Details
Closed on
Dec 18, 2017
Sold by
Baran Adam J
Bought by
Baran Edward T and Janina Tatar M
Purchase Details
Closed on
Jul 7, 1977
Bought by
Baran Adam J and Baran Janina
Create a Home Valuation Report for This Property
The Home Valuation Report is an in-depth analysis detailing your home's value as well as a comparison with similar homes in the area
Purchase History
| Date | Buyer | Sale Price | Title Company |
|---|---|---|---|
| Smith Nora A | $89,000 | None Available | |
| Baran Edward T | -- | -- | |
| Baran Edward T | -- | None Available | |
| Baran Adam J | -- | -- |
Source: Public Records
Mortgage History
| Date | Status | Borrower | Loan Amount |
|---|---|---|---|
| Open | Smith Nora A | $71,200 |
Source: Public Records
Tax History
| Year | Tax Paid | Tax Assessment Tax Assessment Total Assessment is a certain percentage of the fair market value that is determined by local assessors to be the total taxable value of land and additions on the property. | Land | Improvement |
|---|---|---|---|---|
| 2025 | $1,577 | $35,930 | $6,380 | $29,550 |
| 2024 | $1,451 | $35,930 | $6,380 | $29,550 |
| 2023 | $1,426 | $35,930 | $6,380 | $29,550 |
| 2022 | $1,642 | $37,130 | $6,380 | $30,750 |
| 2021 | $1,655 | $37,130 | $6,380 | $30,750 |
| 2020 | $1,705 | $37,130 | $6,380 | $30,750 |
| 2019 | $1,145 | $33,350 | $6,380 | $26,970 |
| 2018 | $1,130 | $33,350 | $6,380 | $26,970 |
| 2017 | $1,092 | $33,350 | $6,380 | $26,970 |
| 2016 | $1,057 | $31,550 | $5,000 | $26,550 |
| 2015 | $1,029 | $31,550 | $5,000 | $26,550 |
| 2014 | $1,033 | $31,550 | $5,000 | $26,550 |
| 2013 | $1,023 | $31,550 | $5,000 | $26,550 |
Source: Public Records
Map
Nearby Homes
- 0 Columbiana Rd
- 2621 Calla Rd E
- 13885 Beard Rd
- 0 Woodworth Rd Unit 5196705
- 28 Shores Dr
- 30 Shores Dr
- 29 Shores Dr
- 4035 Shelly Lynn Dr
- 4025 Shelly Lynn Dr
- 170 Sandy Ct Unit 11
- 170 Sandy Ct Unit 7
- 31 Shores Dr
- 10105 Carrie Ct
- 139 Heron Bay Dr
- 10115 Carrie Ct
- 12 Sandy Dr
- 9868 Unity Rd
- 9663 Youngstown - Pittsburgh Rd
- 1070 Calla Rd E
- 1784 Columbiana Rd
- 2762 S Range
- 2800 E South Range Rd
- 2736 E South Range Rd
- 2751 E South Range Rd
- 2775 E South Range Rd
- 2824 E South Range Rd
- 2750 E South Range Rd
- 2704 E South Range Rd
- 2705 E South Range Rd
- 2851 E South Range Rd
- 2660 E South Range Rd
- 2654 E South Range Rd
- 2909 E South Range Rd
- 2874 E South Range Rd
- 2627 E South Range Rd
- 2919 E South Range Rd
- 2950 E South Range Rd
- 2610 E South Range Rd
- 2601 E South Range Rd
- 2969 E South Range Rd
Your Personal Tour Guide
Ask me questions while you tour the home.