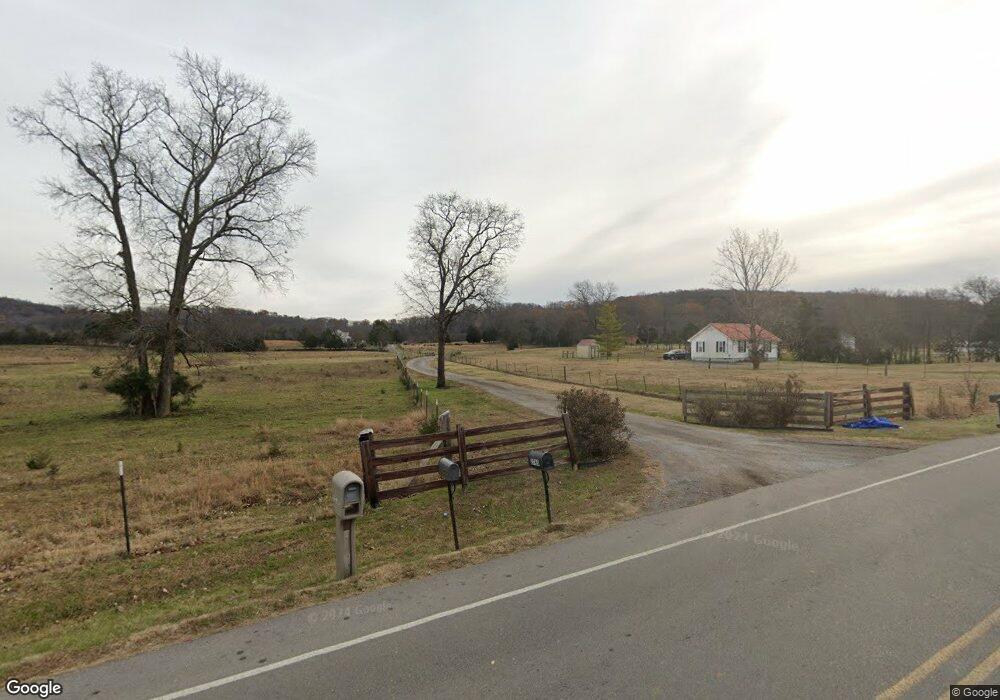
2763 SE Tater Peeler Rd Lebanon, TN 37090
Estimated Value: $317,000 - $539,000
--
Bed
2
Baths
1,128
Sq Ft
$395/Sq Ft
Est. Value
About This Home
This home is located at 2763 SE Tater Peeler Rd, Lebanon, TN 37090 and is currently estimated at $445,587, approximately $395 per square foot. 2763 SE Tater Peeler Rd is a home located in Wilson County with nearby schools including Southside Elementary School and Wilson Central High School.
Ownership History
Date
Name
Owned For
Owner Type
Purchase Details
Closed on
Nov 22, 2019
Sold by
Robinson Stanley W and Robinson Regina
Bought by
Fall Creek Development Llc
Current Estimated Value
Home Financials for this Owner
Home Financials are based on the most recent Mortgage that was taken out on this home.
Original Mortgage
$1,200,000
Interest Rate
3.5%
Mortgage Type
Commercial
Purchase Details
Closed on
Jan 3, 2001
Bought by
Robinson Stanley
Purchase Details
Closed on
Aug 18, 2000
Sold by
Paul Crumpler
Bought by
Wilson Bank & Trust
Purchase Details
Closed on
Jan 5, 2000
Sold by
Wilson Bank & Trust
Bought by
Stanley Robinson
Purchase Details
Closed on
Oct 6, 1997
Sold by
Byrd J E
Bought by
Paul Crumpler
Purchase Details
Closed on
Oct 9, 1973
Bought by
Byrd Byrd J and Byrd Barbara
Create a Home Valuation Report for This Property
The Home Valuation Report is an in-depth analysis detailing your home's value as well as a comparison with similar homes in the area
Home Values in the Area
Average Home Value in this Area
Purchase History
| Date | Buyer | Sale Price | Title Company |
|---|---|---|---|
| Fall Creek Development Llc | $1,200,000 | Birthright Title Llc | |
| Robinson Stanley | $90,000 | -- | |
| Wilson Bank & Trust | $100,000 | -- | |
| Stanley Robinson | $90,000 | -- | |
| Paul Crumpler | $59,900 | -- | |
| Byrd Byrd J | -- | -- |
Source: Public Records
Mortgage History
| Date | Status | Borrower | Loan Amount |
|---|---|---|---|
| Closed | Fall Creek Development Llc | $1,200,000 |
Source: Public Records
Tax History Compared to Growth
Tax History
| Year | Tax Paid | Tax Assessment Tax Assessment Total Assessment is a certain percentage of the fair market value that is determined by local assessors to be the total taxable value of land and additions on the property. | Land | Improvement |
|---|---|---|---|---|
| 2024 | $860 | $45,050 | $18,950 | $26,100 |
| 2022 | $860 | $45,050 | $18,950 | $26,100 |
| 2021 | $860 | $72,125 | $46,025 | $26,100 |
| 2020 | $957 | $45,050 | $18,950 | $26,100 |
| 2019 | $957 | $37,975 | $14,300 | $23,675 |
| 2018 | $957 | $37,975 | $14,300 | $23,675 |
| 2017 | $957 | $37,975 | $14,300 | $23,675 |
| 2016 | $957 | $37,975 | $14,300 | $23,675 |
| 2015 | $976 | $37,975 | $14,300 | $23,675 |
| 2014 | $744 | $28,929 | $0 | $0 |
Source: Public Records
Map
Nearby Homes
- 2600 SE Tater Peeler Rd
- 3056 SE Tater Peeler Rd
- 3720 SE Tater Peeler Rd
- 137 Sara Cir
- 0 Hartmann Dr S Unit RTC2784157
- 521 Hinton St
- 0 SE Tater Peeler Rd
- Gatlinburg Plan at One Lebanon Place - Avenue Collection
- 424 Seneca St
- Highland Plan at One Lebanon Place - Avenue Collection
- Westbrook Plan at One Lebanon Place - Avenue Collection
- 426 Seneca St
- 418 Seneca St
- 146 Barton Village Blvd
- 148 Barton Village Blvd
- 154 Barton Village Blvd
- 158 Barton Village Blvd
- 3663 Cainsville Rd
- 150 Barton Village Blvd
- Kimberly Plan at The Crossings at Barton Village
- 2765 SE Tater Peeler Rd
- 2575 SE Tater Peeler Rd
- 2839 SE Tater Peeler Rd
- 3315 SE Tater Peeler Rd
- 2801 SE Tater Peeler Rd
- 2885 SE Tater Peeler Rd
- 2961 SE Tater Peeler Rd
- 2987 SE Tater Peeler Rd
- 350 Moriah Dr
- 3065 SE Tater Peeler Rd
- 2748 SE Tater Peeler Rd
- 2810 SE Tater Peeler Rd
- 2780 SE Tater Peeler Rd
- 2840 SE Tater Peeler Rd
- 2874 SE Tater Peeler Rd
- 2896 SE Tater Peeler Rd
- 3181 SE Tater Peeler Rd
- 2519 SE Tater Peeler Rd
- 2970 SE Tater Peeler Rd
- 2944 SE Tater Peeler Rd