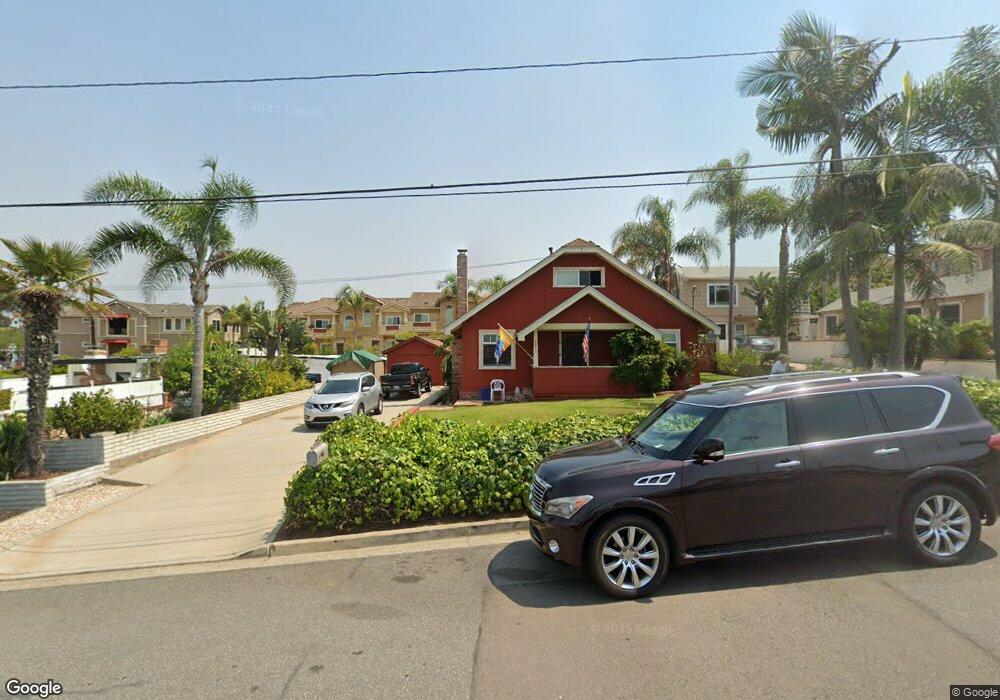
2764 Carlsbad Blvd Unit 103 Carlsbad, CA 92008
Carlsbad Village NeighborhoodEstimated Value: $1,274,119 - $2,027,000
3
Beds
3
Baths
1,558
Sq Ft
$1,106/Sq Ft
Est. Value
About This Home
This home is located at 2764 Carlsbad Blvd Unit 103, Carlsbad, CA 92008 and is currently estimated at $1,723,530, approximately $1,106 per square foot. 2764 Carlsbad Blvd Unit 103 is a home located in San Diego County with nearby schools including Buena Vista Elementary, Carlsbad High School, and Sage Creek High.
Ownership History
Date
Name
Owned For
Owner Type
Purchase Details
Closed on
Nov 24, 2008
Sold by
Weinstein Howard L and Weinstent Leona M
Bought by
Liberio Rocco J and Liberio Kathleen M
Current Estimated Value
Home Financials for this Owner
Home Financials are based on the most recent Mortgage that was taken out on this home.
Original Mortgage
$350,000
Outstanding Balance
$230,923
Interest Rate
6.1%
Mortgage Type
Unknown
Estimated Equity
$1,492,607
Purchase Details
Closed on
Mar 16, 2005
Sold by
Anastasi Development Co Llc
Bought by
Weinstein Howard L and Weinstein Leona M
Home Financials for this Owner
Home Financials are based on the most recent Mortgage that was taken out on this home.
Original Mortgage
$639,900
Interest Rate
5.53%
Mortgage Type
Unknown
Create a Home Valuation Report for This Property
The Home Valuation Report is an in-depth analysis detailing your home's value as well as a comparison with similar homes in the area
Home Values in the Area
Average Home Value in this Area
Purchase History
| Date | Buyer | Sale Price | Title Company |
|---|---|---|---|
| Liberio Rocco J | $638,500 | Fidelity National Title | |
| Weinstein Howard L | $800,000 | First American Title |
Source: Public Records
Mortgage History
| Date | Status | Borrower | Loan Amount |
|---|---|---|---|
| Open | Liberio Rocco J | $350,000 | |
| Previous Owner | Weinstein Howard L | $639,900 |
Source: Public Records
Tax History Compared to Growth
Tax History
| Year | Tax Paid | Tax Assessment Tax Assessment Total Assessment is a certain percentage of the fair market value that is determined by local assessors to be the total taxable value of land and additions on the property. | Land | Improvement |
|---|---|---|---|---|
| 2025 | $8,600 | $821,910 | $575,414 | $246,496 |
| 2024 | $8,600 | $805,795 | $564,132 | $241,663 |
| 2023 | $8,557 | $789,996 | $553,071 | $236,925 |
| 2022 | $8,425 | $774,507 | $542,227 | $232,280 |
| 2021 | $8,362 | $759,322 | $531,596 | $227,726 |
| 2020 | $8,305 | $751,537 | $526,146 | $225,391 |
| 2019 | $8,155 | $736,802 | $515,830 | $220,972 |
| 2018 | $7,809 | $722,356 | $505,716 | $216,640 |
| 2017 | $7,680 | $708,193 | $495,800 | $212,393 |
| 2016 | $7,371 | $694,308 | $486,079 | $208,229 |
| 2015 | $7,341 | $683,880 | $478,778 | $205,102 |
| 2014 | $7,218 | $670,485 | $469,400 | $201,085 |
Source: Public Records
Map
Nearby Homes
- 2901 Ocean St Unit 3
- 2646 State St
- 2646 State St Unit D
- 2648 State St
- 2977 Ocean St
- 2633 Ocean St
- 2672 Roosevelt St
- 2670 Roosevelt St
- 2664 Roosevelt St
- 2517 State St
- 725 Grand Ave
- 543 Laguna Dr Unit 3
- 2465 Garfield St
- 2438 Ocean St
- 3097 Madison St
- 774 Laguna Dr
- 3258 Tyler St
- 79 St Malo Unit 79
- 1010 Grand Ave
- 2535 Jefferson St Unit 10
- 2764 Carlsbad Blvd Unit 104
- 2764 Carlsbad Blvd Unit 102
- 2764 Carlsbad Blvd Unit 101
- 2764 Carlsbad Blvd Unit 100
- 2768 Carlsbad Blvd
- 2768 Carlsbd Blvd Ct Unit 100
- 2768 Carlsbad Blvd
- 2768 Carlsbad Blvd Unit 100
- 2768 Carlsbad Blvd Unit 101
- 2768 Carlsbad Blvd Unit 102
- 2768 Carlsbad Blvd Unit 103
- 2768 Carlsbad Blvd Unit 104
- 2748 Carlsbad Blvd
- 2748 Carlsbad Blvd Unit 102
- 2748 Carlsbad Blvd Unit 101
- 2748 Carlsbad Blvd Unit 103
- 2748 Carlsbad Blvd Unit 100
- 2778 Carlsbad Blvd Unit 302
- 2760 Carlsbad Blvd
- 2778 Carlsbad Blvd Unit 100