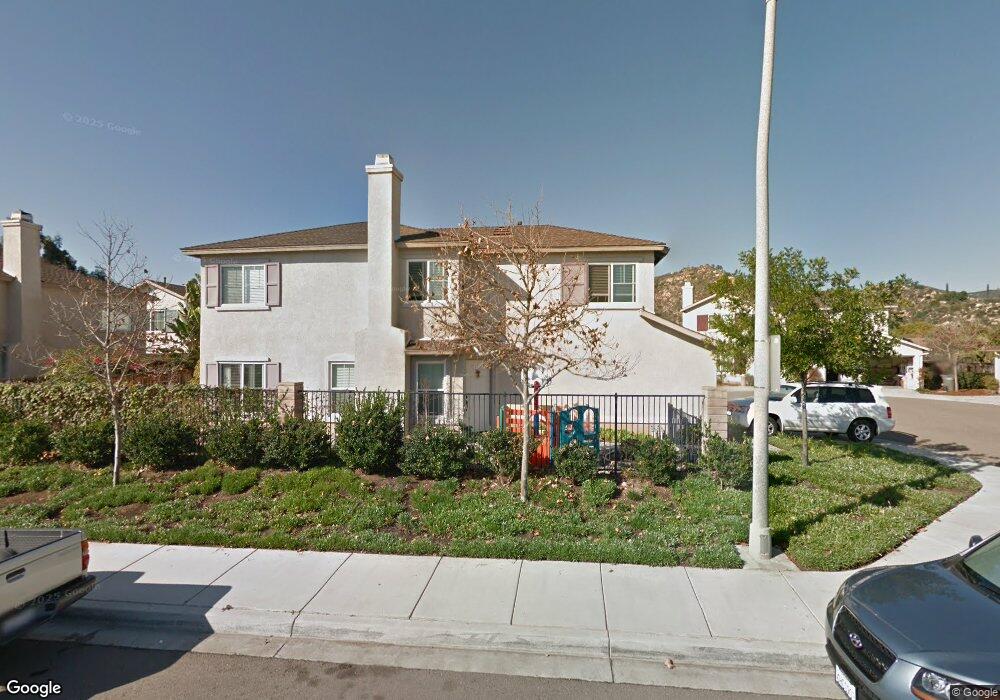
2764 Wanek Rd Unit 14 Escondido, CA 92027
East Grove NeighborhoodEstimated Value: $619,000 - $715,000
3
Beds
3
Baths
1,522
Sq Ft
$434/Sq Ft
Est. Value
About This Home
This home is located at 2764 Wanek Rd Unit 14, Escondido, CA 92027 and is currently estimated at $660,035, approximately $433 per square foot. 2764 Wanek Rd Unit 14 is a home located in San Diego County with nearby schools including Glen View Elementary School, Hidden Valley Middle School, and Orange Glen High School.
Ownership History
Date
Name
Owned For
Owner Type
Purchase Details
Closed on
Aug 8, 2017
Sold by
Yuca Rivera Isidro and Pak Christine
Bought by
Rucra Rivera Isidro and Pak Christine
Current Estimated Value
Purchase Details
Closed on
Dec 19, 2002
Sold by
Yucra Rivera Isidro and Pak Christine
Bought by
Yucra Rivera Isidro and Pak Christine
Home Financials for this Owner
Home Financials are based on the most recent Mortgage that was taken out on this home.
Original Mortgage
$215,000
Outstanding Balance
$90,490
Interest Rate
5.96%
Mortgage Type
Purchase Money Mortgage
Estimated Equity
$569,545
Purchase Details
Closed on
Apr 2, 2002
Sold by
Pak Chu
Bought by
Pak Min C
Purchase Details
Closed on
Jan 27, 2002
Sold by
Wanek Llc
Bought by
Yucra Rivera Isidro and Pak Christine
Home Financials for this Owner
Home Financials are based on the most recent Mortgage that was taken out on this home.
Original Mortgage
$214,900
Interest Rate
6.78%
Mortgage Type
FHA
Create a Home Valuation Report for This Property
The Home Valuation Report is an in-depth analysis detailing your home's value as well as a comparison with similar homes in the area
Home Values in the Area
Average Home Value in this Area
Purchase History
| Date | Buyer | Sale Price | Title Company |
|---|---|---|---|
| Rucra Rivera Isidro | -- | None Available | |
| Yucra Rivera Isidro | -- | Fidelity National Title Co | |
| Pak Min C | -- | Chicago Title | |
| Yucra Rivera Isidro | $235,000 | Chicago Title Co |
Source: Public Records
Mortgage History
| Date | Status | Borrower | Loan Amount |
|---|---|---|---|
| Open | Yucra Rivera Isidro | $215,000 | |
| Previous Owner | Yucra Rivera Isidro | $214,900 |
Source: Public Records
Tax History Compared to Growth
Tax History
| Year | Tax Paid | Tax Assessment Tax Assessment Total Assessment is a certain percentage of the fair market value that is determined by local assessors to be the total taxable value of land and additions on the property. | Land | Improvement |
|---|---|---|---|---|
| 2025 | $3,828 | $347,001 | $103,405 | $243,596 |
| 2024 | $3,828 | $340,198 | $101,378 | $238,820 |
| 2023 | $3,740 | $333,529 | $99,391 | $234,138 |
| 2022 | $3,698 | $326,991 | $97,443 | $229,548 |
| 2021 | $3,637 | $320,581 | $95,533 | $225,048 |
| 2020 | $3,615 | $317,295 | $94,554 | $222,741 |
| 2019 | $3,527 | $311,074 | $92,700 | $218,374 |
| 2018 | $3,428 | $304,976 | $90,883 | $214,093 |
| 2017 | $3,371 | $298,997 | $89,101 | $209,896 |
| 2016 | $3,305 | $293,135 | $87,354 | $205,781 |
| 2015 | $3,277 | $288,732 | $86,042 | $202,690 |
| 2014 | -- | $283,077 | $84,357 | $198,720 |
Source: Public Records
Map
Nearby Homes
- 2566 White Oak Place Unit 6
- 2700 E Valley Pkwy Unit 189
- 2700 E Valley Pkwy Unit Spc 81
- 2700 E Valley Pkwy Unit 315
- 2700 E Valley Pkwy Unit 64
- 2561 White Oak Place Unit 1
- 2700e Valley Pkwy Unit 81
- 609 Jacks Creek Rd
- 2550 E Valley Pkwy Unit 122
- 472 Devonshire Glen
- 2469 Turnbridge Glen
- 157 Belfast Glen
- 3137 E Valley Pkwy
- 3135 E Valley Pkwy
- 705 Sungold Way
- 112 Encanto Dr
- 220 James St
- 2928 Burnet Dr
- 770 Sungold Way
- 2300 E Valley Pkwy Unit 194
- 2796 Wanek Rd
- 2790 Wanek Rd Unit 19
- 2746 Wanek Rd
- 2714 Wanek Rd
- 2786 Wanek Rd
- 2778 Wanek Rd
- 2760 Wanek Rd
- 2758 Wanek Rd
- 2750 Wanek Rd
- 2734 Wanek Rd Unit 8
- 2730 Wanek Rd Unit 7
- 2726 Wanek Rd Unit 6
- 2722 Wanek Rd
- 2718 Wanek Rd
- 2772 Wanek Rd Unit 15
- 2742 Wanek Rd Unit 9
- 2702 Wanek Rd Unit 1
- 2708 Wanek Rd
- 2788 Wanek Rd Unit 18
- 2768 Derringer Place