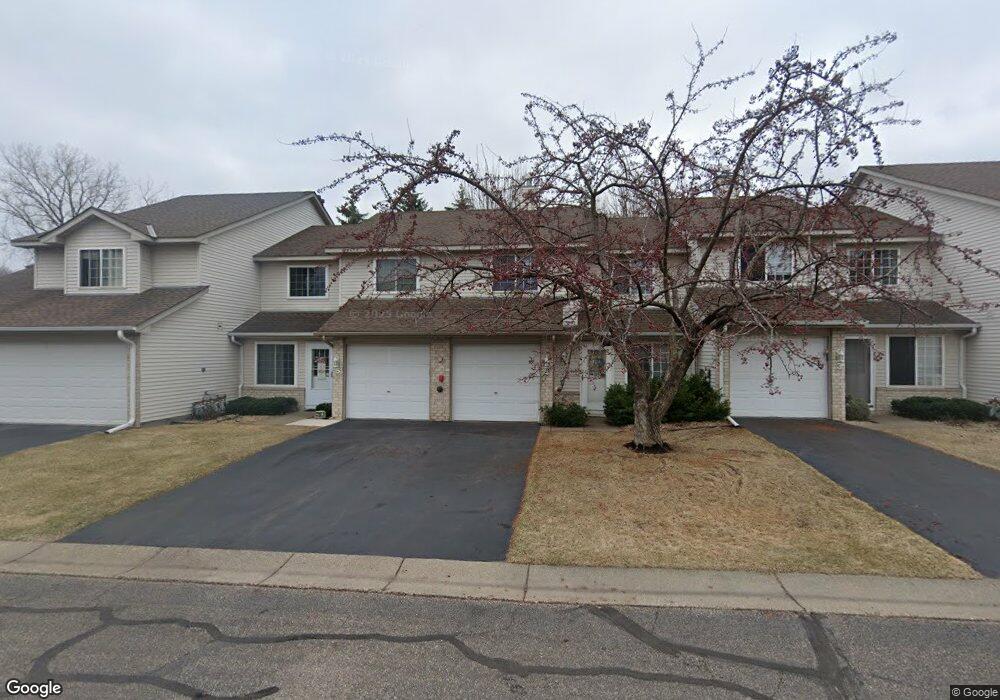
2765 Ranchview Ln N Unit 1 Plymouth, MN 55447
Estimated Value: $233,000 - $252,843
2
Beds
2
Baths
1,224
Sq Ft
$199/Sq Ft
Est. Value
About This Home
This home is located at 2765 Ranchview Ln N Unit 1, Plymouth, MN 55447 and is currently estimated at $243,961, approximately $199 per square foot. 2765 Ranchview Ln N Unit 1 is a home located in Hennepin County with nearby schools including Birchview Elementary School, Wayzata Central Middle School, and Wayzata High School.
Ownership History
Date
Name
Owned For
Owner Type
Purchase Details
Closed on
Aug 3, 2015
Sold by
Fossey Marissa E and Fossey Todd M
Bought by
Rohlik Beth A
Current Estimated Value
Purchase Details
Closed on
Jan 29, 2014
Sold by
Fossey Marissa E and Fossey Todd M
Bought by
Fossey Marissa E and Fossey Todd M
Home Financials for this Owner
Home Financials are based on the most recent Mortgage that was taken out on this home.
Original Mortgage
$174,500
Interest Rate
4.55%
Mortgage Type
New Conventional
Purchase Details
Closed on
Jan 16, 2007
Sold by
Mess Shannon K
Bought by
Pierce Marissa
Purchase Details
Closed on
Sep 24, 2004
Sold by
Haider Vicki J
Bought by
Mess Shannon K
Purchase Details
Closed on
Feb 26, 1998
Sold by
Thurber Barbara J
Bought by
Haider Vicki J
Create a Home Valuation Report for This Property
The Home Valuation Report is an in-depth analysis detailing your home's value as well as a comparison with similar homes in the area
Home Values in the Area
Average Home Value in this Area
Purchase History
| Date | Buyer | Sale Price | Title Company |
|---|---|---|---|
| Rohlik Beth A | $175,000 | Edina Realty Title Inc | |
| Fossey Marissa E | -- | Executive Title Inc | |
| Pierce Marissa | $190,500 | -- | |
| Mess Shannon K | $184,900 | -- | |
| Haider Vicki J | $107,900 | -- |
Source: Public Records
Mortgage History
| Date | Status | Borrower | Loan Amount |
|---|---|---|---|
| Previous Owner | Fossey Marissa E | $174,500 |
Source: Public Records
Tax History Compared to Growth
Tax History
| Year | Tax Paid | Tax Assessment Tax Assessment Total Assessment is a certain percentage of the fair market value that is determined by local assessors to be the total taxable value of land and additions on the property. | Land | Improvement |
|---|---|---|---|---|
| 2024 | $2,579 | $249,100 | $40,000 | $209,100 |
| 2023 | $2,498 | $244,700 | $33,000 | $211,700 |
| 2022 | $2,289 | $245,000 | $41,000 | $204,000 |
| 2021 | $2,194 | $202,000 | $32,000 | $170,000 |
| 2020 | $2,260 | $195,000 | $32,000 | $163,000 |
| 2019 | $2,030 | $195,000 | $37,000 | $158,000 |
| 2018 | $1,974 | $178,000 | $34,000 | $144,000 |
| 2017 | $1,796 | $160,000 | $31,000 | $129,000 |
| 2016 | $1,429 | $130,000 | $28,000 | $102,000 |
| 2015 | $1,742 | $129,400 | $27,800 | $101,600 |
| 2014 | -- | $109,200 | $24,900 | $84,300 |
Source: Public Records
Map
Nearby Homes
- 2728 Shenandoah Ln N
- 2783 Upland Ct
- 15620 24th Ave N Unit B
- 15625 24th Ave N Unit E
- 2635 Weston Ln N
- 2225 Ranchview Ln N Unit 5
- 2040 Shenandoah Ct Unit B
- 16520 27th Ave N
- 1900 Shenandoah Ct Unit H
- 1930 Lanewood Ln N
- 15655 17th Place N
- 15640 16th Ave N
- 16035 36th Place N
- 1705 Archer Ct
- 1712 Archer Ct
- 17015 30th Ave N
- 15800 16th Ave N
- 1737 Archer Ct
- 1850 Comstock Ln N
- 3605 Archer Ln N
- 2765 Ranchview Ln N Unit 7
- 2765 Ranchview Ln N Unit 6
- 2765 Ranchview Ln N Unit 5
- 2765 Ranchview Ln N Unit 4
- 2765 Ranchview Ln N Unit 3
- 2765 Ranchview Ln N Unit 2
- 2765 2765 Ranchview Ln N
- 2775 2775 Ranchview Ln N
- 2775 Ranchview Ln N Unit 12
- 2775 Ranchview Ln N Unit 11
- 2775 Ranchview Ln N Unit 9
- 2775 Ranchview Ln N Unit 8
- 2775 Ranchview Ln N Unit 7
- 2775 Ranchview Ln N Unit 6
- 2775 Ranchview Ln N Unit 5
- 2775 Ranchview Ln N Unit 4
- 2775 Ranchview Ln N Unit 3
- 2775 Ranchview Ln N Unit 2
- 2775 Ranchview Ln N Unit 1
- 2672 Shenandoah Ln N